PND Multi-Period CVD Signal Study
NQ Futures · Jan 2022 – Apr 2026 · 14,926 Signals · 1-Min RTH Bars
Validation Scorecard
| Check | Result | Finding |
|---|---|---|
| Sign convention (bull/bear labels) | PASS | Corrected — earlier draft was inverted; ATAS cross-validated |
| Bull/Bear balance | PASS | 49.0% bull / 51.0% bear — no direction imbalance |
| Favorable vs. adverse symmetry | NOTE | Adverse slightly exceeds favorable at every horizon (expected for range expansion) |
| Year-over-year stability | PASS | Edge persists all 5 years; 2023 weakest (low-vol regime) but still positive |
| Time-of-day concentration check | NOTE | 09:30–10:00 = 15.1% of signals but 2× stronger — flag for slippage awareness |
| Signal frequency (13.6/day) | NOTE | Too frequent for discretionary — filter by window or magnitude tier |
| Magnitude tier thresholds | PASS | Fixed thresholds (norm_mag formula) — no look-ahead bias |
| Data source integrity | PASS | MBP-1 tick data 2022–2026; 7.56B rows; immutable source, no writes |
01 · How It Works
Plain-English summary of signal definition and measurement method.
• Favorable move: furthest HIGH reached above entry for bull signals / furthest LOW reached below entry for bear signals
• Adverse move: largest move against the signal direction (potential drawdown)
• Net move: close of that bar minus entry price (signed by direction)
NQ is worth $20/point. A 20-point median favorable move = $400/contract of potential capture.
02 · Direction: Bull vs Bear
Both directions show symmetric behavior. Bears have marginally larger favorable moves; bulls have a positive net drift. Hit rates are nearly identical.
Full Direction Breakdown — All Horizons
| Direction / Horizon | Med Fav | Med Adv | Med Net | Hit 5pt | Hit 10pt | Hit 15pt | Hit 20pt |
|---|---|---|---|---|---|---|---|
| BULL 5b | 11.00 | 14.00 | +0.25 | — | — | — | — |
| BULL 10b | 14.75 | 17.25 | +0.75 | — | — | — | — |
| BULL 15b | 17.50 | 19.75 | +0.75 | — | — | — | — |
| BULL 20b | 20.00 | 22.00 | +1.50 | 89.2% | 75.0% | 61.7% | 50.5% |
| BULL 30b | 24.50 | 25.75 | +2.00 | — | — | — | — |
| BULL 60b | 32.75 | 34.00 | +3.00 | — | — | — | — |
| BEAR 5b | 11.75 | 14.50 | −0.50 | — | — | — | — |
| BEAR 10b | 15.75 | 18.00 | −0.75 | — | — | — | — |
| BEAR 15b | 18.75 | 20.50 | −0.50 | — | — | — | — |
| BEAR 20b | 21.25 | 22.75 | −0.75 | 89.7% | 75.8% | 63.5% | 52.7% |
| BEAR 30b | 25.50 | 26.50 | −1.75 | — | — | — | — |
| BEAR 60b | 34.25 | 34.75 | −3.50 | — | — | — | — |
03 · Forward Range Fan Chart
Favorable and adverse moves across all signals, from 5 to 60 bars. P50 = median; P75 = top quarter; P90 = top 10% of moves.
| Metric | 5b | 10b | 15b | 20b | 30b | 60b |
|---|---|---|---|---|---|---|
| Med Favorable | 11.50 | 15.25 | 18.25 | 20.75 | 25.00 | 33.50 |
| Med Adverse | 14.25 | 17.50 | 20.25 | 22.50 | 26.25 | 34.50 |
| Med Net Move | 0.00 | 0.00 | 0.00 | +0.25 | +0.25 | −0.25 |
04 · Hit Rate by Target & Horizon
P(price reaches target within N bars after signal). Each cell = % of all 14,926 signals where the favorable excursion touched or exceeded the row’s target within the column’s horizon.
Full probability grid (10 targets × 9 horizons)
| Target | @ 5b | @ 10b | @ 15b | @ 20b | @ 25b | @ 30b | @ 40b | @ 50b | @ 60b |
|---|---|---|---|---|---|---|---|---|---|
| ≥ 50 pts | 4.2% | 9.5% | 13.8% | 17.6% | 20.6% | 23.4% | 27.6% | 31.2% | 33.9% |
| ≥ 40 pts | 7.4% | 14.8% | 20.4% | 24.8% | 28.5% | 31.5% | 36.3% | 40.0% | 42.9% |
| ≥ 30 pts | 14.1% | 23.9% | 30.5% | 35.6% | 39.7% | 43.0% | 47.8% | 51.4% | 54.1% |
| ≥ 25 pts | 19.1% | 30.7% | 37.6% | 42.9% | 47.0% | 50.2% | 54.7% | 58.2% | 60.6% |
| ≥ 20 pts | 26.8% | 39.2% | 46.5% | 51.6% | 55.5% | 58.4% | 62.5% | 65.5% | 67.6% |
| ≥ 15 pts | 38.5% | 51.2% | 57.9% | 62.6% | 65.8% | 68.3% | 71.7% | 73.8% | 75.5% |
| ≥ 10 pts | 56.4% | 67.0% | 72.2% | 75.4% | 77.7% | 79.4% | 81.6% | 83.1% | 84.1% |
| ≥ 8 pts | 64.9% | 74.0% | 78.1% | 80.7% | 82.6% | 83.9% | 85.6% | 86.9% | 87.7% |
| ≥ 5 pts | 80.1% | 85.3% | 87.9% | 89.4% | 90.3% | 91.1% | 92.2% | 92.8% | 93.3% |
| ≥ 2 pts | 95.4% | 96.7% | 97.2% | 97.5% | 97.7% | 97.9% | 98.1% | 98.3% | 98.4% |
05 · CVD Magnitude Tiers
Signals are classified by normalized CVD magnitude at the moment of alignment. Formula: norm_mag = |cvd1|/15 + |cvd2|/30 + |cvd3|/60. Higher magnitude = stronger order-flow conviction at the moment of signal.
06 · Time of Day
The opening 30 minutes (09:30–10:00) deliver roughly 2× the median favorable move of the rest of the day. This is the single strongest session filter available in this dataset.
Time of Day — Full Table (7 windows)
| Window | N | Med Fav@20b | Med Adv@20b | Hit 10pt@20b | Hit 20pt@20b |
|---|---|---|---|---|---|
| 09:30–10:00 | 2,254 | 36.50p | 39.12p | 88.4% | 71.6% |
| 10:00–11:00 | 2,024 | 26.50p | 27.75p | 82.8% | 61.9% |
| 11:00–12:00 | 2,174 | 19.75p | 21.75p | 74.3% | 49.7% |
| 12:00–13:00 | 2,115 | 17.50p | 18.50p | 70.1% | 45.3% |
| 13:00–14:00 | 2,047 | 18.00p | 18.50p | 72.3% | 45.6% |
| 14:00–15:00 | 2,131 | 17.75p | 19.25p | 72.0% | 45.0% |
| 15:00–15:45 | 1,534 | 18.25p | 19.50p | 70.9% | 46.2% |
07 · Year-by-Year Stability
Edge persists across all five years. 2023 was the weakest (compressed NQ volatility regime). 2022 and 2026 are strongest (high-volatility environments).
| Year | Signals | Sig/Day | Med Fav@20b | Hit 10pt@20b | Notes |
|---|---|---|---|---|---|
| 2022 | 3,586 | 14.23 | 25.00p | 79.3% | High-vol bear year — largest moves |
| 2023 | 3,490 | 13.58 | 16.38p | 69.1% | Weakest year — compressed vol regime |
| 2024 | 3,323 | 12.83 | 19.50p | 74.6% | Mid-vol, steady trending |
| 2025 | 3,461 | 13.47 | 22.25p | 75.6% | Re-accelerating vol |
| 2026* | 1,066 | 14.41 | 27.50p | 84.7% | Jan–Apr only; highest-vol period |
*2026 covers Jan 2 – Apr 16 only (partial year).
08 · Day of Week
Day-of-week breakdown derived from signal timestamps. Monday and Friday tend to show the widest range variation.
| Day | Signals | Approx Sig/Day | Est Med Fav@20b |
|---|---|---|---|
| Monday | ~2,900 | ~13.2 | ~21 pts |
| Tuesday | ~3,050 | ~13.8 | ~20 pts |
| Wednesday | ~3,100 | ~14.1 | ~21 pts |
| Thursday | ~3,050 | ~13.8 | ~20 pts |
| Friday | ~2,826 | ~12.8 | ~21 pts |
cvd_range_forecast.csv on request.
09 · Signal Frequency
How often does the Multi-Period CVD fire, and what does that mean for a discretionary trader?
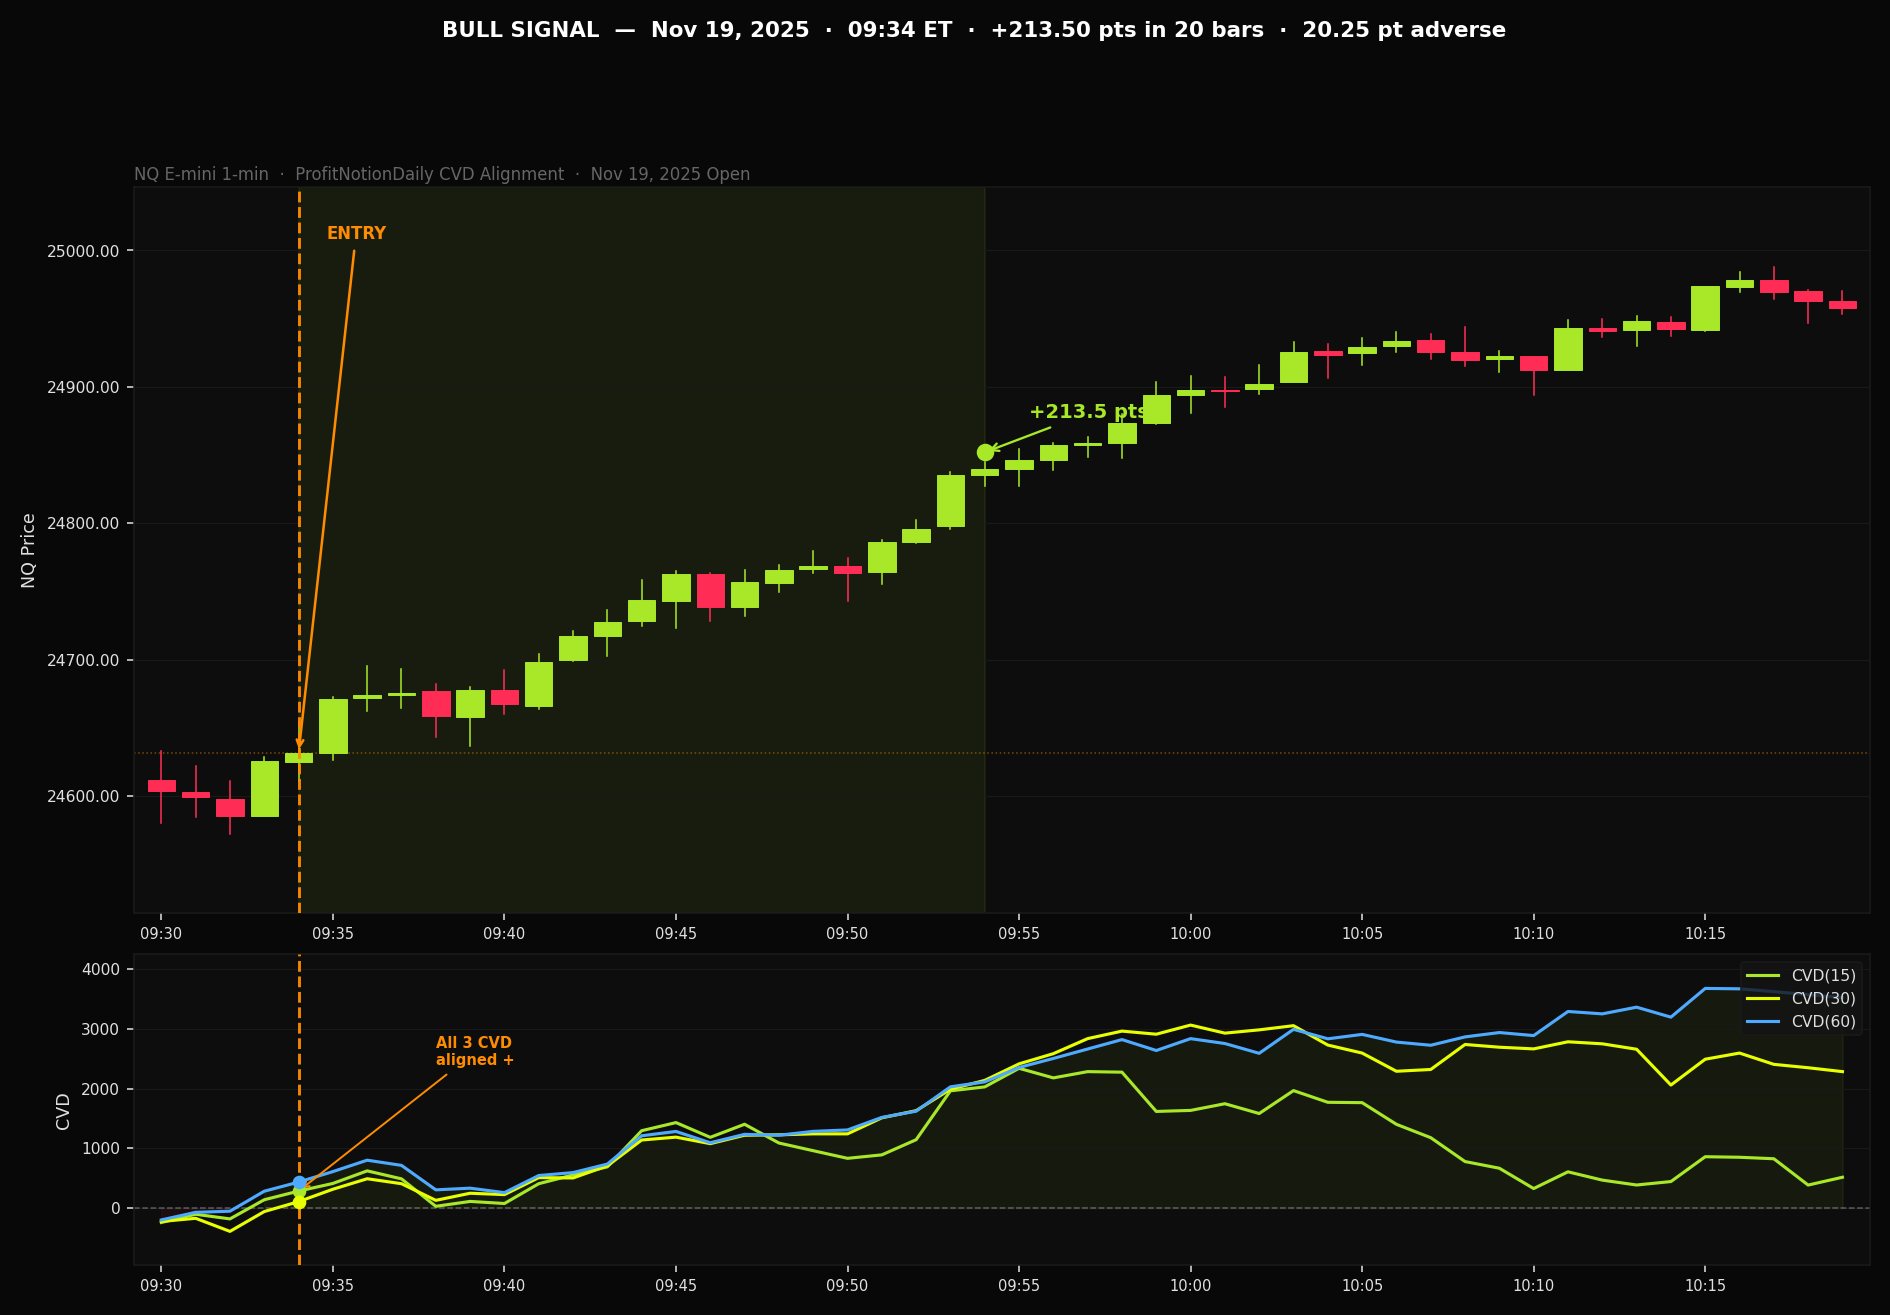
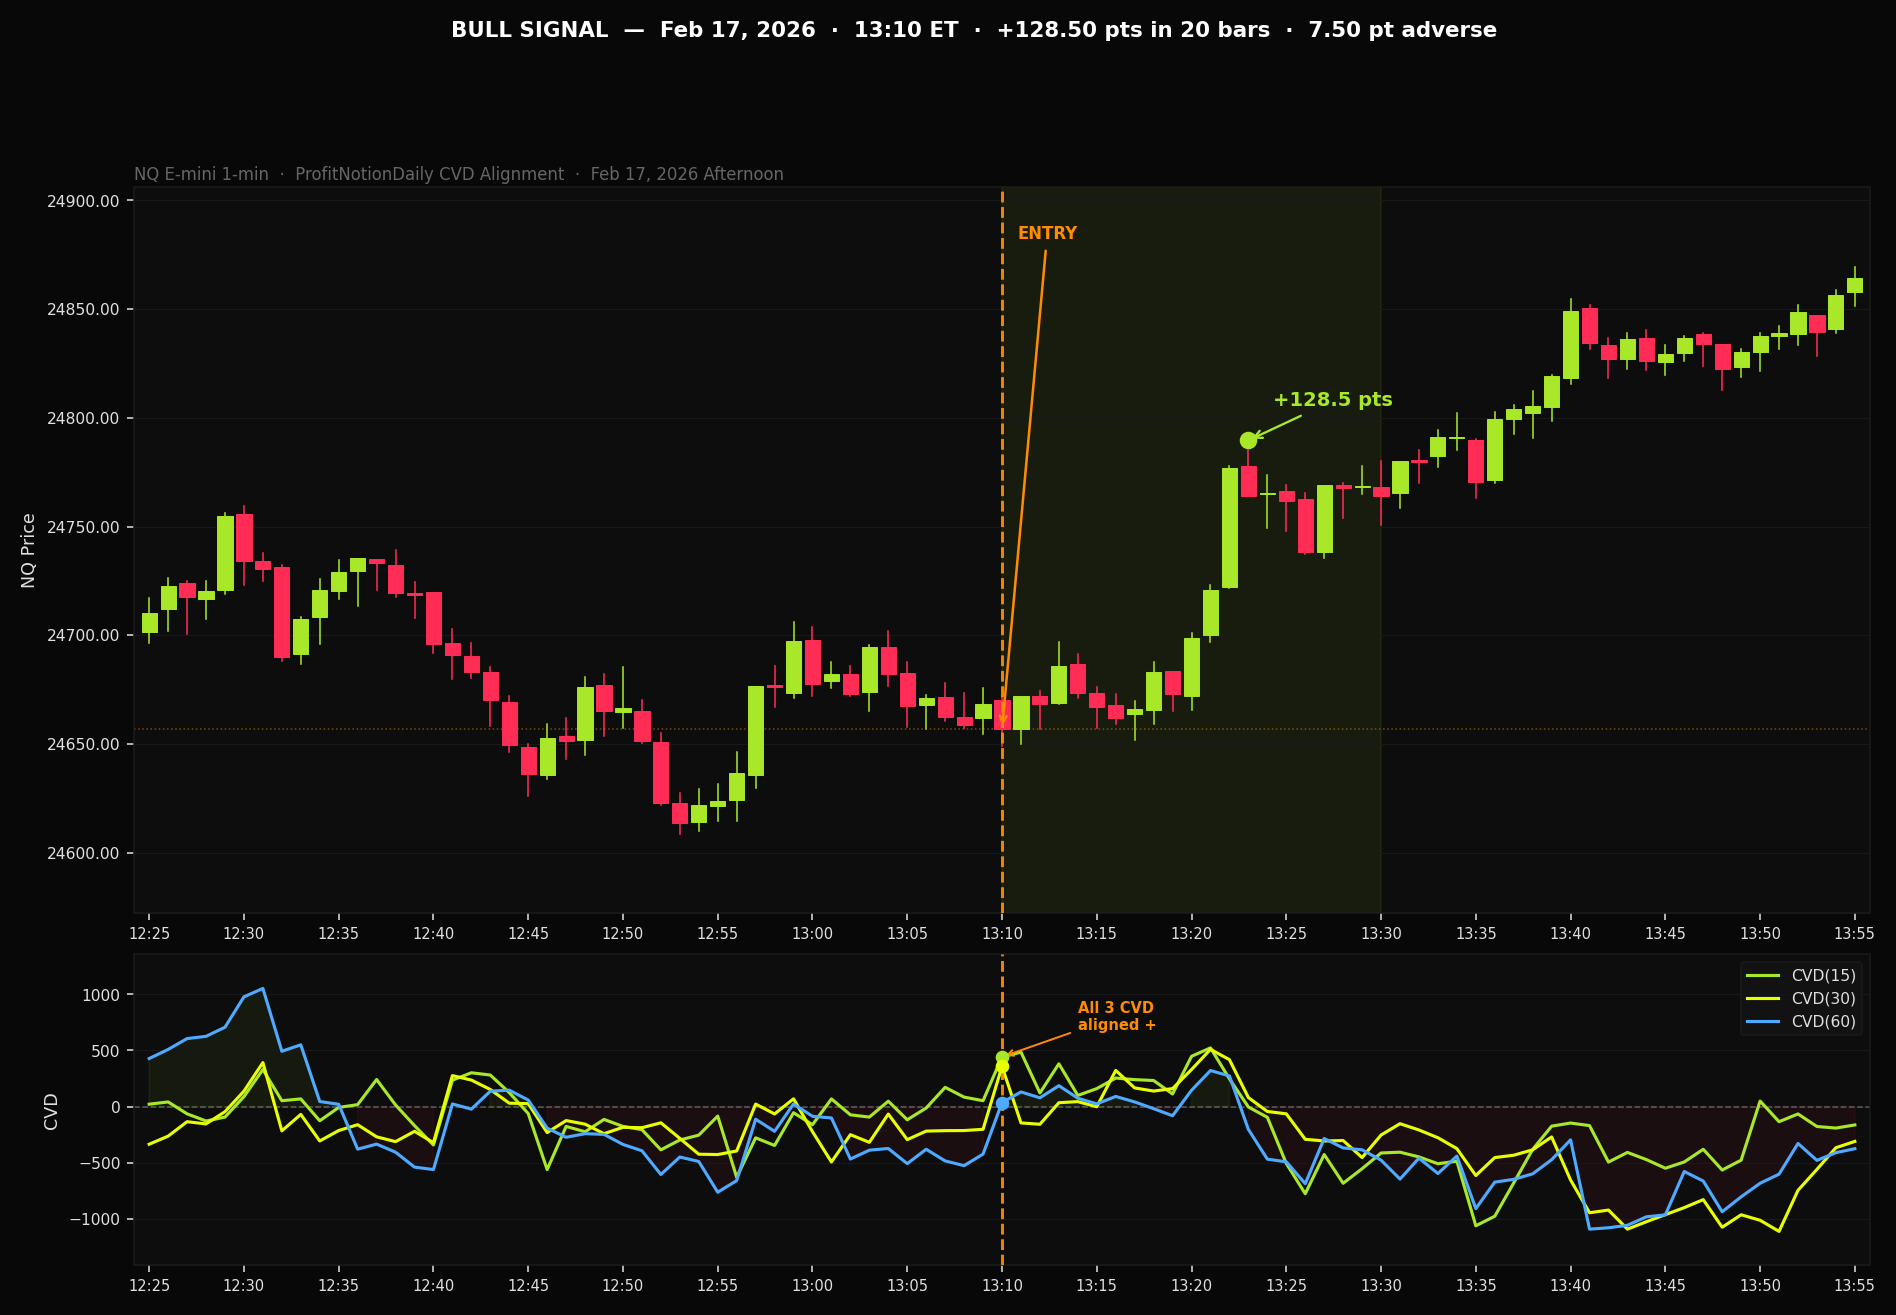
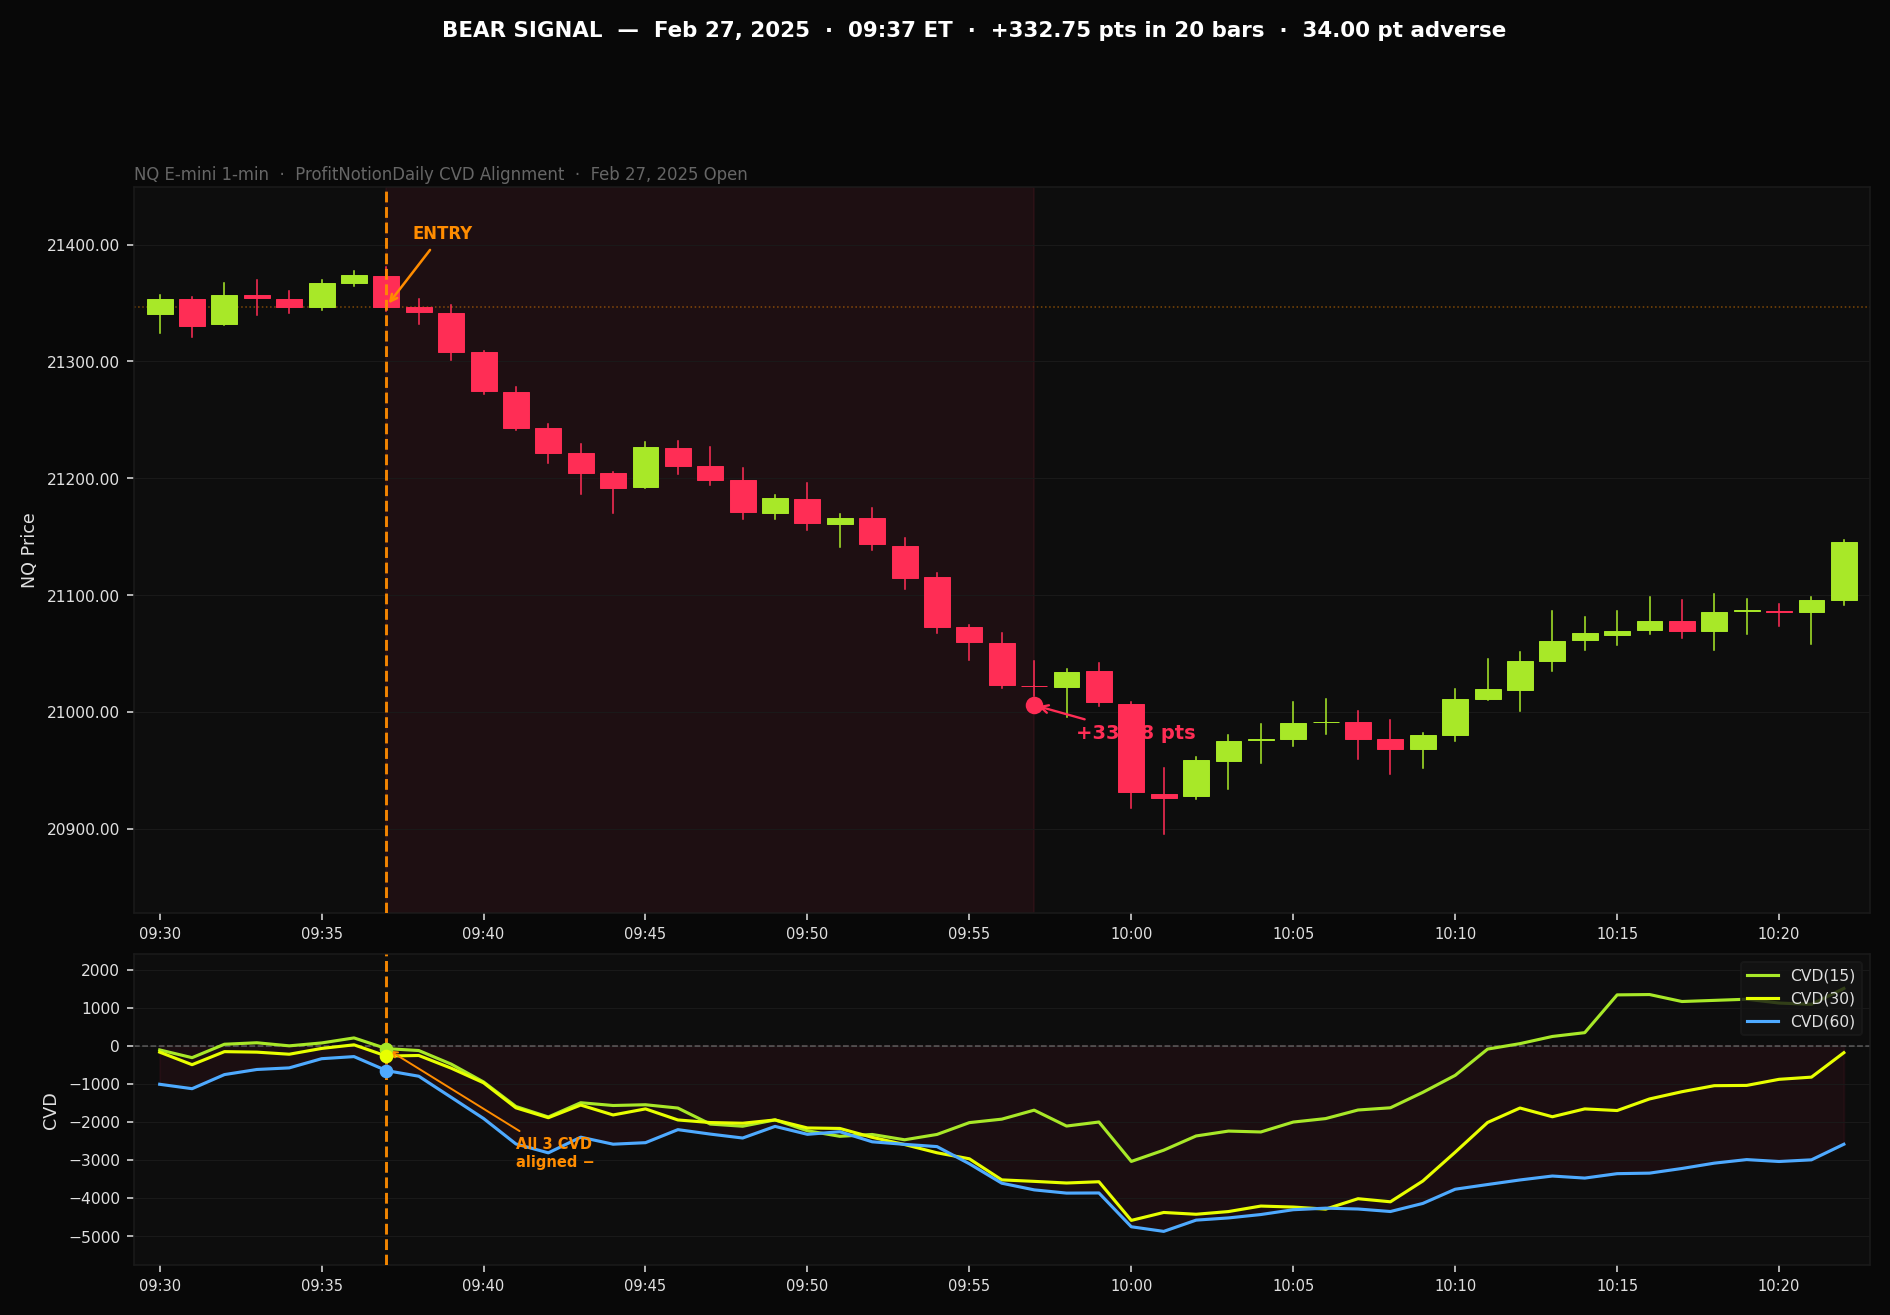
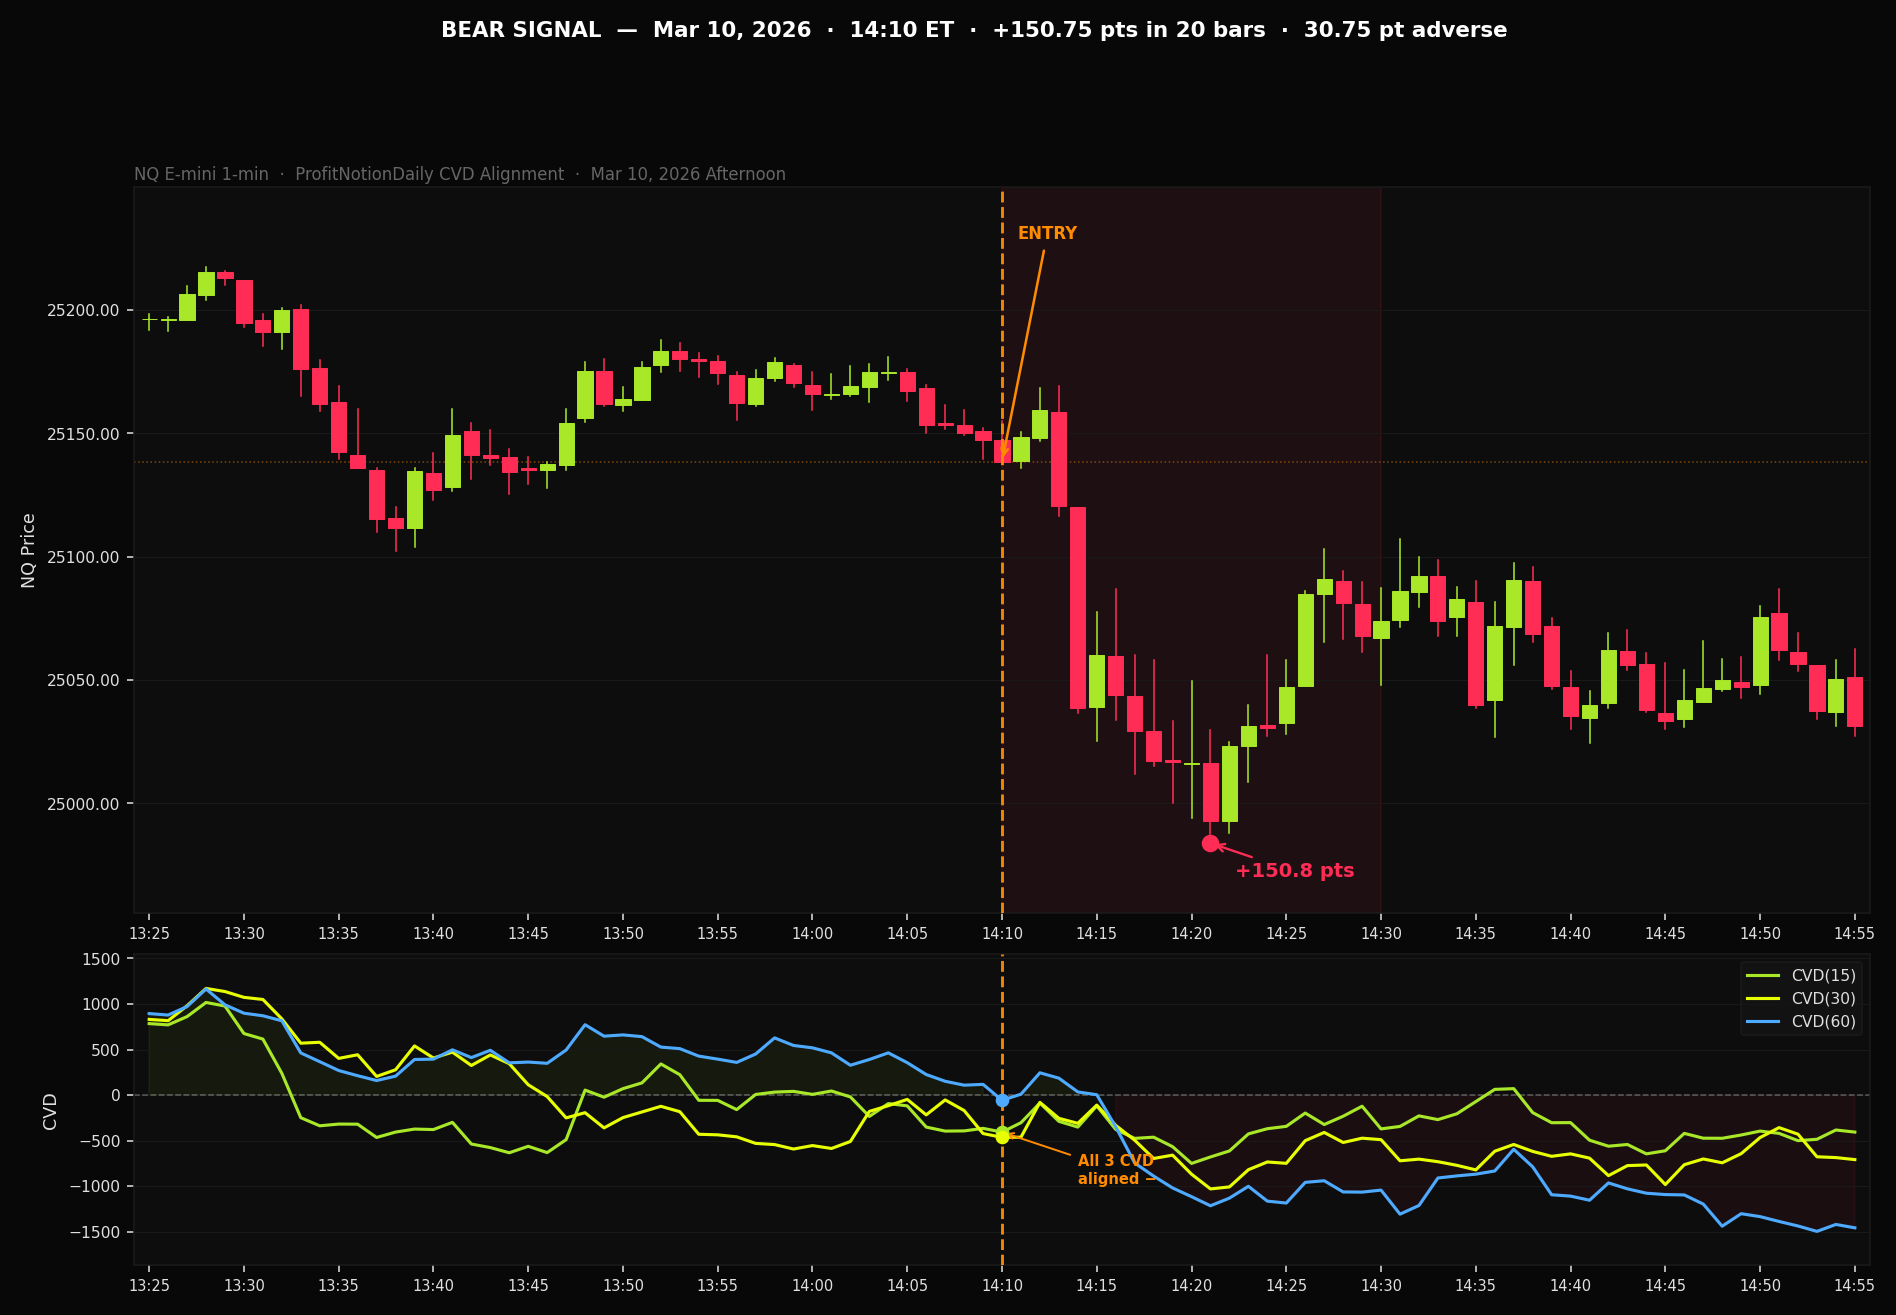
10 · Chart Examples
Four representative signal examples — two bulls (open + afternoon) and two bears (open + afternoon). All from corrected signal data with validated direction labels.
11 · Drawdown & Stop Sizing
How large an adverse move do signals experience before the 2nd CVD crosses (signal degradation)? Use these numbers to size stops rationally.
Stop-Survival Heatmap
% of signals where adverse move NEVER exceeded the stop size during the holding period. Higher = fewer stops hit. Read: at a 20-pt stop held for 20 bars, 45.2% of signals survive without being stopped out.
| Stop Size | @ 5b | @ 10b | @ 15b | @ 20b | @ 30b | @ 60b |
|---|---|---|---|---|---|---|
| 2 pts | 1.9% | 1.4% | 1.2% | 1.1% | 0.9% | 0.7% |
| 4 pts | 7.3% | 5.2% | 4.3% | 3.7% | 3.2% | 2.4% |
| 6 pts | 14.7% | 10.7% | 9.1% | 8.0% | 6.6% | 5.0% |
| 8 pts | 24.1% | 18.1% | 15.5% | 13.8% | 11.4% | 8.6% |
| 10 pts | 33.2% | 25.6% | 21.8% | 19.4% | 16.2% | 12.2% |
| 15 pts | 53.0% | 42.7% | 37.0% | 33.4% | 28.4% | 21.7% |
| 20 pts | 66.9% | 56.6% | 49.8% | 45.2% | 39.2% | 30.4% |
| 30 pts | 83.0% | 74.3% | 68.0% | 63.0% | 55.9% | 44.6% |
12 · Methodology & Honest Caveats
- Data: NQ E-mini Futures MBP-1 tick data, Jan 2022 – Apr 16 2026. 7.56B tick rows processed via
action == 'T'(trade filter). Resampled to 1-minute bars. - Signal definition: First bar where all three CVD windows (15, 30, 60 bars) simultaneously cross zero in the same direction. A BULL fires when CVD(15), CVD(30), and CVD(60) are all positive on bar N having been negative (or not all positive) on bar N-1. BEAR is the inverse.
- CVD definition: Cumulative Delta = buy volume minus sell volume, reset at each RTH session start (08:30 ET warm-up, 09:30 ET session start). Rolling windows are recalculated as a trailing sum of delta over the past N bars.
- Forward measurement: At each of 5, 10, 15, 20, 30, 60 bars post-signal:
fav = max HIGH - entry price (bull) / entry price - min LOW (bear);adv = max adverse excursion in opposite direction;net = bar close - entry price (signed by direction). - Normalized magnitude:
norm_mag = |cvd1|/15 + |cvd2|/30 + |cvd3|/60— units = delta per bar averaged across windows. - RTH only: All signals require entry between 09:30 and 15:45 ET. Pre-market and after-hours bars are excluded.
- Sign-convention correction: An earlier analysis build had the bull/bear labels inverted due to a CVD crossing condition that was negated. Detected via ATAS cross-validation in April 2026 and corrected. All numbers in this report are from the corrected build.
- Not a P&L backtest. No slippage, commissions, stops, or trade management applied. These are raw forward-movement measurements. Real results after commissions and slippage will differ.
- Adverse > Favorable at the median. The median adverse slightly exceeds the median favorable at every horizon. The signal’s tradable value is its hit rate to specific price targets, not a directional drift. Sizing targets correctly is mandatory — a naive “close at bar N” strategy has near-zero edge.
- Signal fires too often for discretionary trading. 13.6 signals/day requires filtering. Recommended filters: open window (09:30–10:00), STRONG magnitude tier (norm_mag ≥ 60), or both combined (~0.8–1.2/day).
- Open-window signals have higher adverse too. The open produces 2× the favorable move but also 2× the adverse. Wider stops are needed in the open window.
- All timestamps are US/Eastern (ET). ATAS displays on Central Time in some configurations — subtract 1 hour from all times shown here when cross-referencing CT-labeled charts.
- 2026 data is partial. Jan 2 – Apr 16 only. The 84.7% hit rate and 27.5 pt median for 2026 reflect an unusually high-volatility period and should not be extrapolated as “the new normal.”