Does CVD by Trade Size Tell You Where NQ Is Headed?
NQ Futures · last 12 months of data (May 2025 – Apr 2026) · 249 trading days, every one starting 08:30 ET (1hr warmup before the 9:30 RTH open) · every size from 1 to 500+ contracts
- Split every NQ trade over the last 12 months into size groups.
- Tested one question per group: does its flow predict price, confirm it, or tell you nothing?
- Read the takeaways box below and you have the whole report — everything after it is the proof, in charts.
- The ATAS "Cumulative Trades" setting changes the answer, not just the strength. Several size groups flip from net buying to net selling (or back) just by toggling it.Keep it checked ON — see the section below.
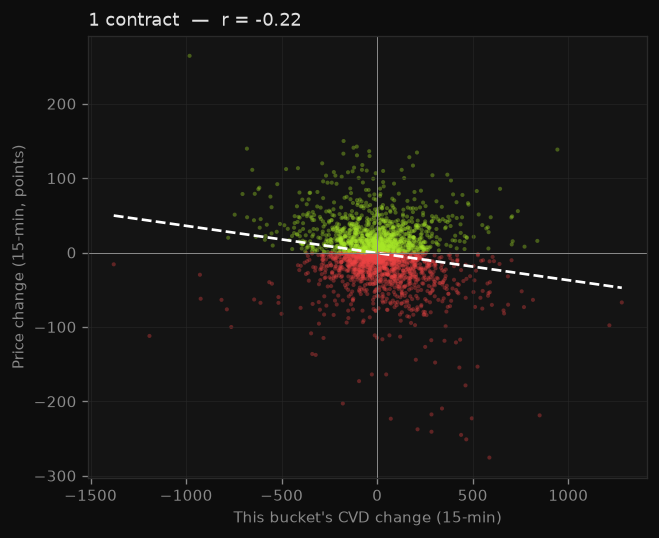
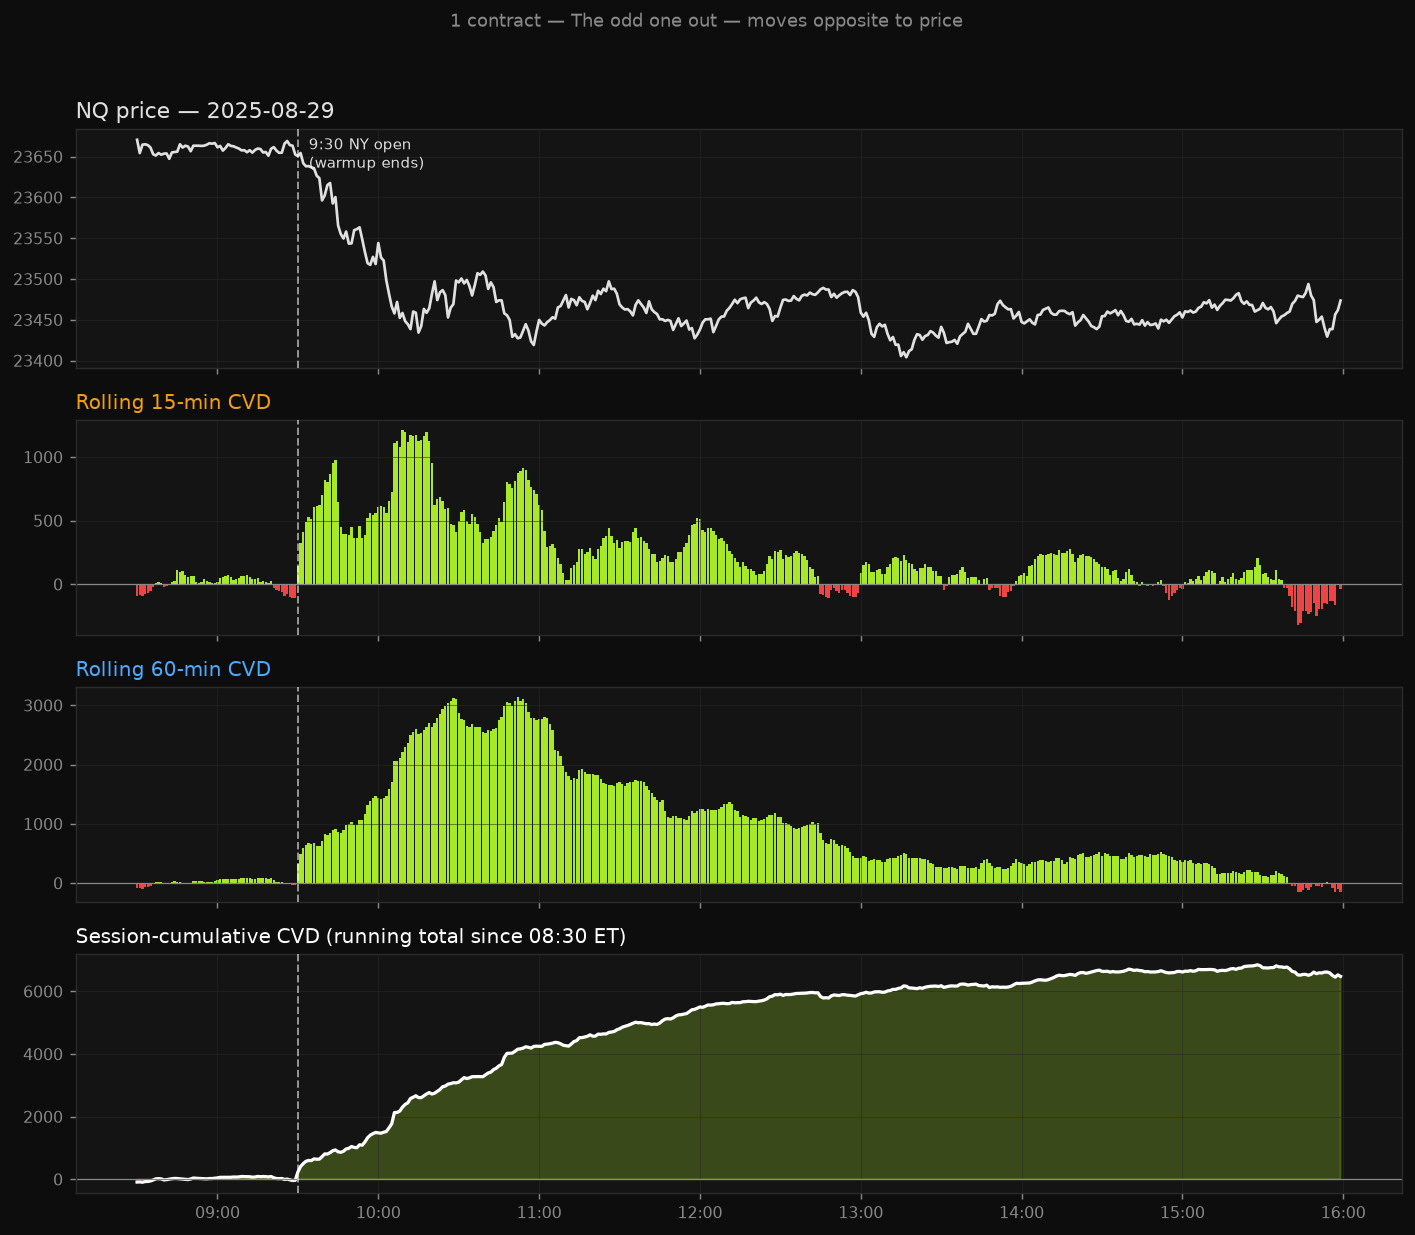
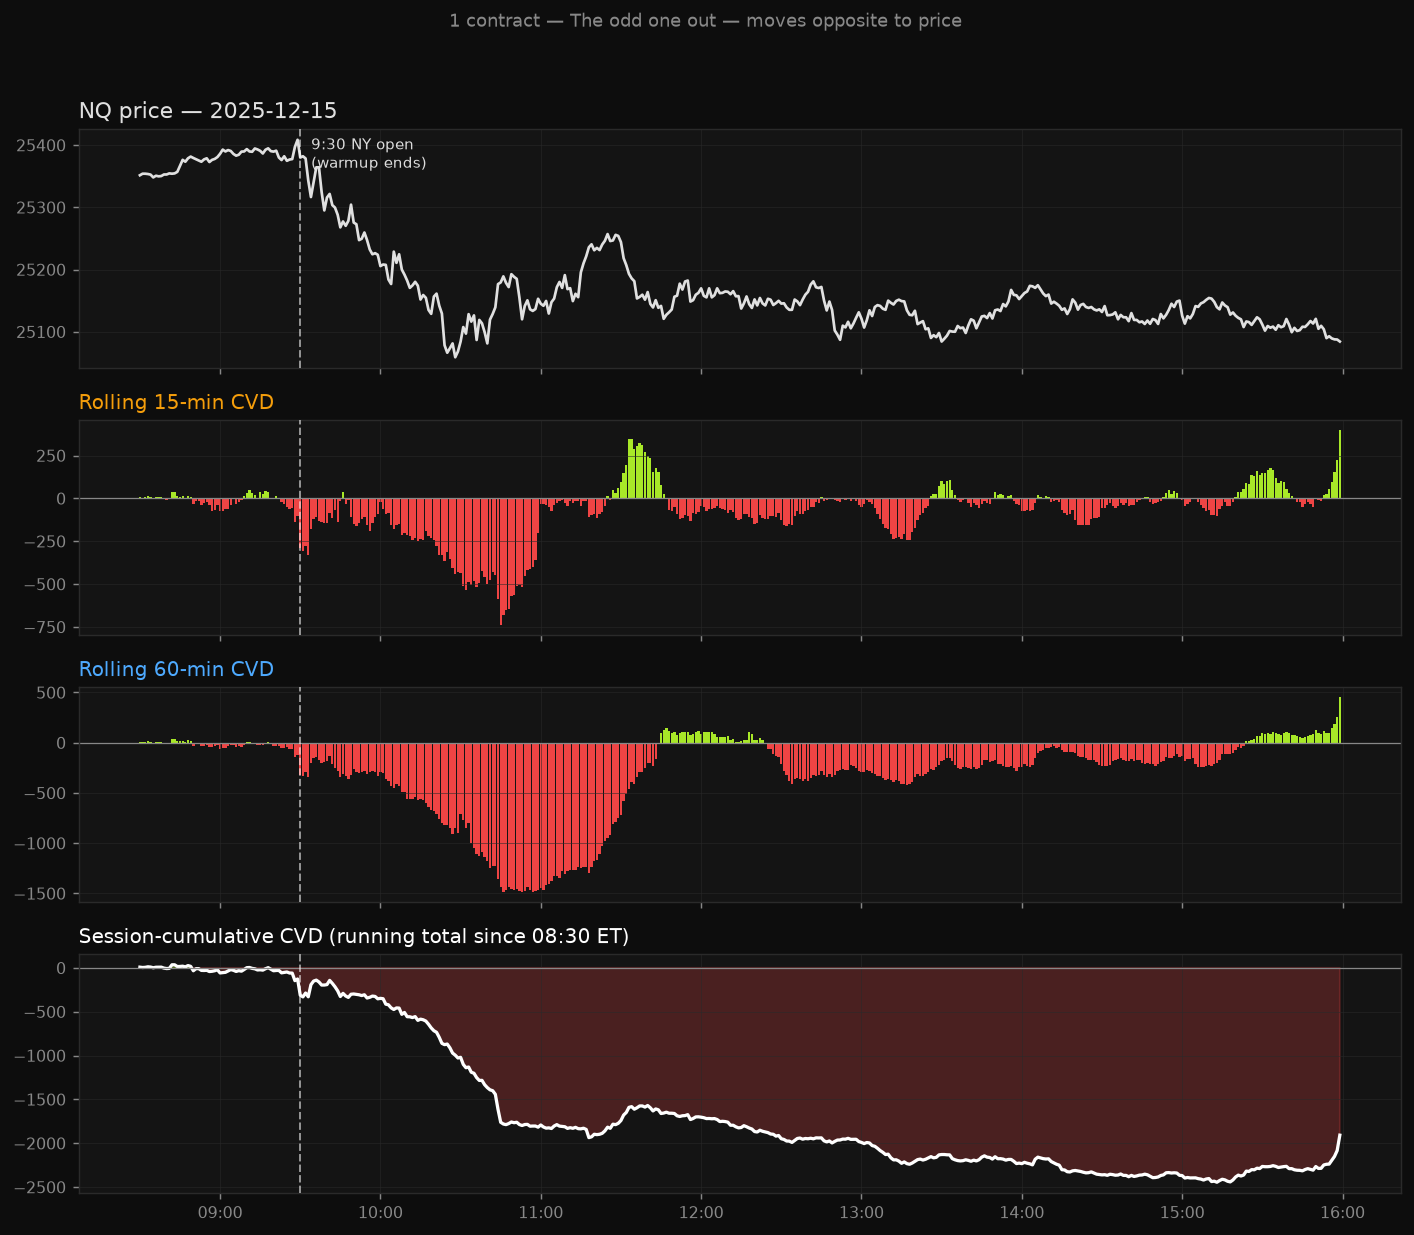
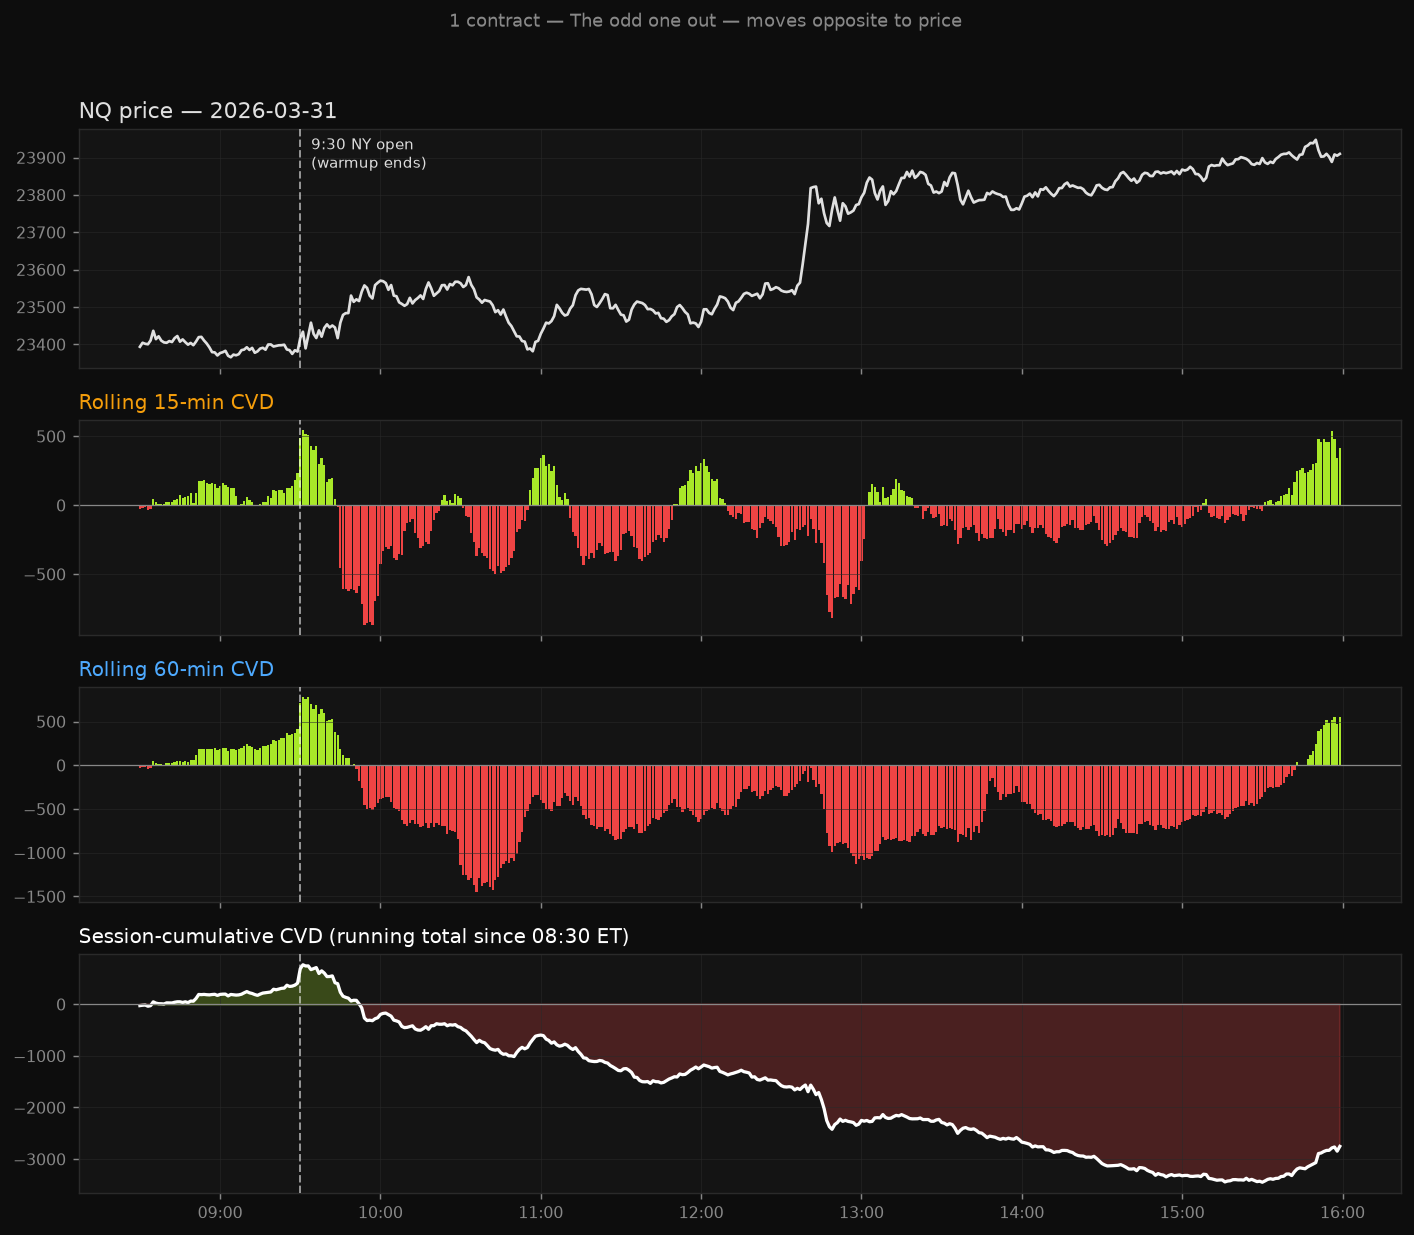
- 1-contract trades move against price, not with it — the one real surprise in this whole study.See "the sweet spot" section.
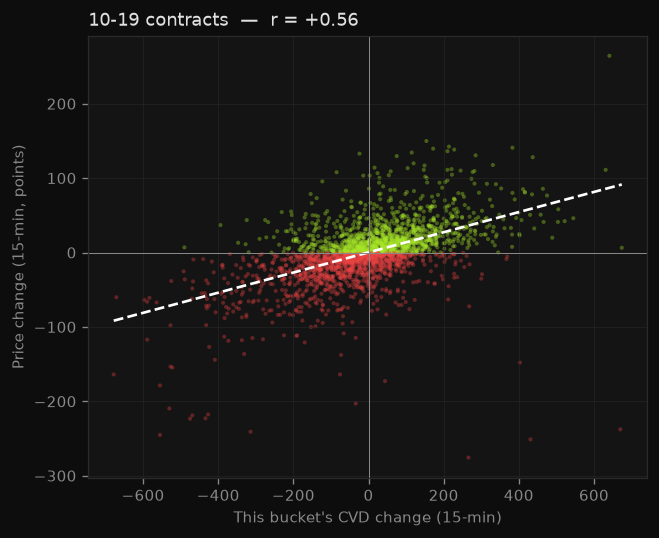
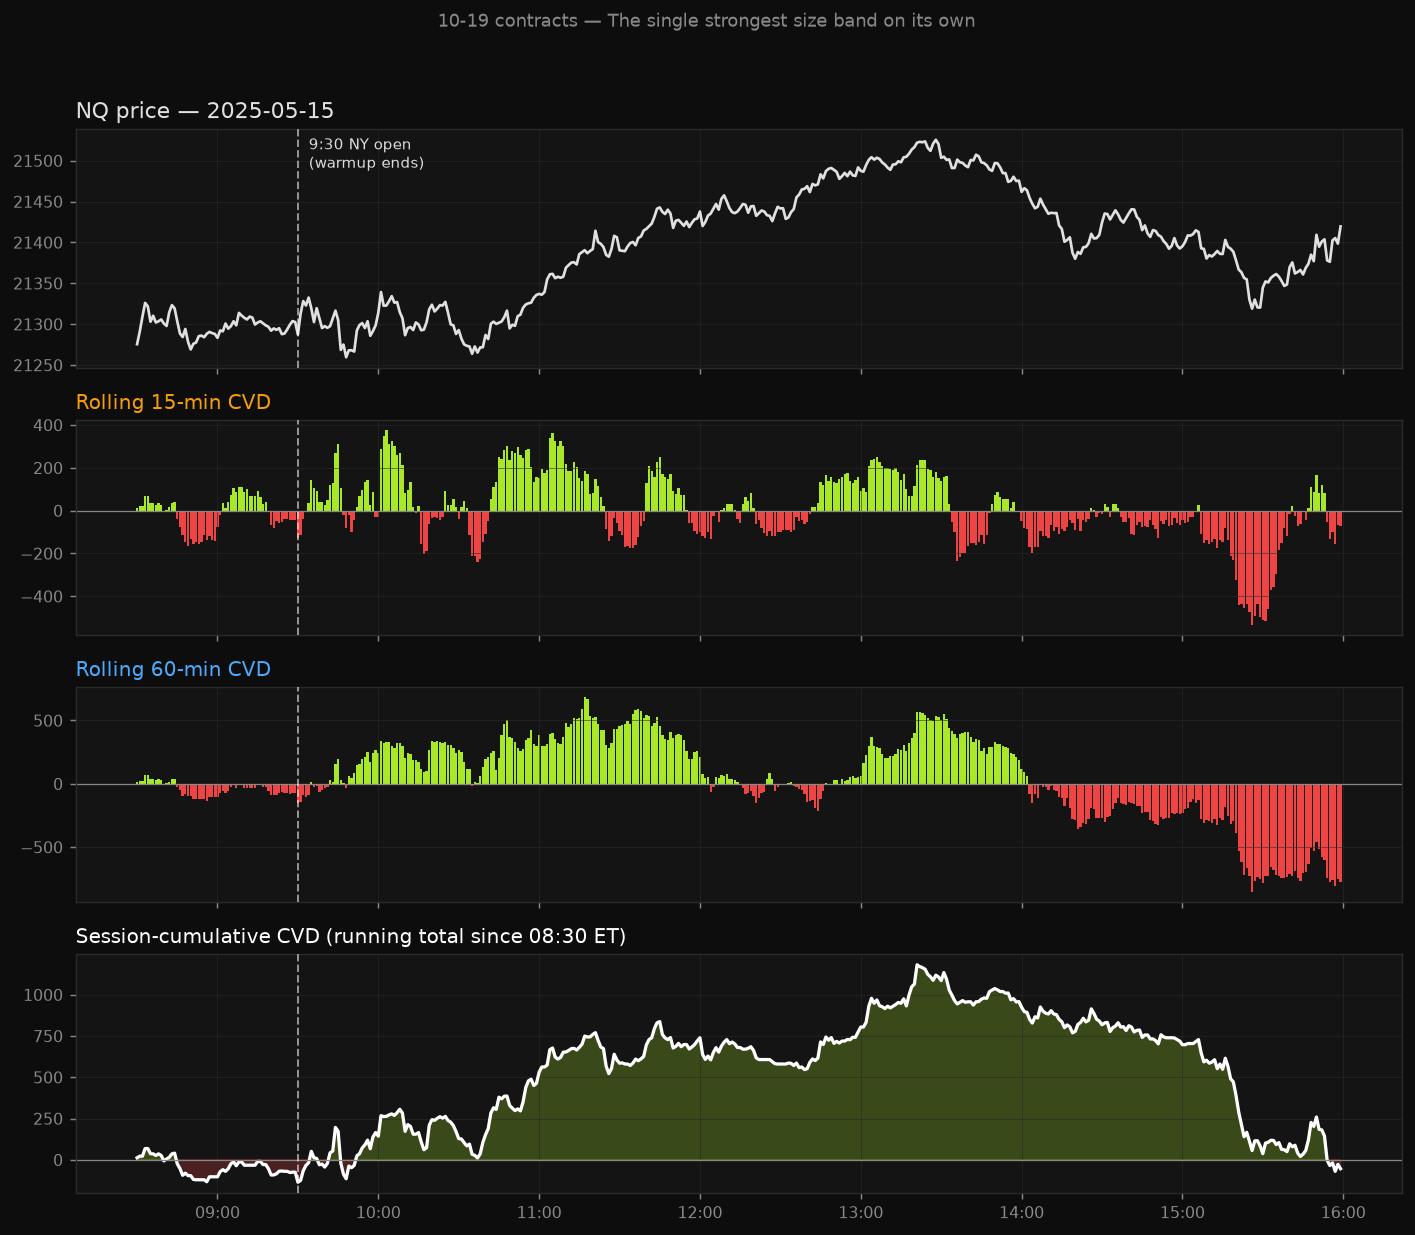
- 10-19 contracts is the single best size range to watch on its own. Bigger isn't better — correlation gets weaker as size climbs past that.
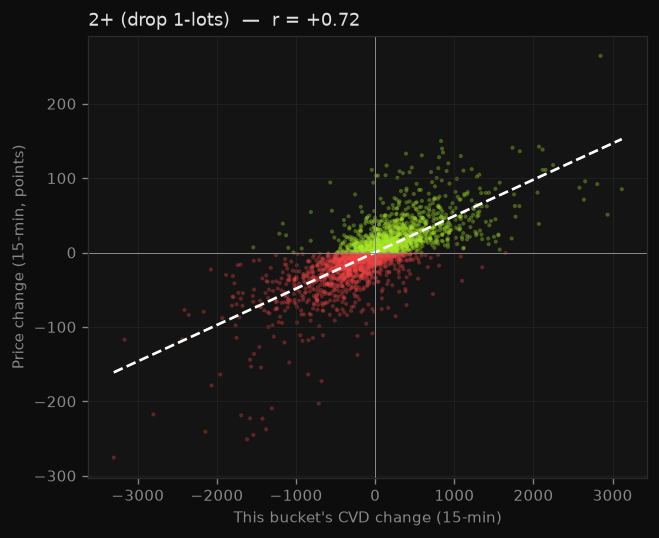
- The simplest effective filter: watch everything except 1-lots ("2+"). It beat every other combination we tested, including "big trades only" filters.
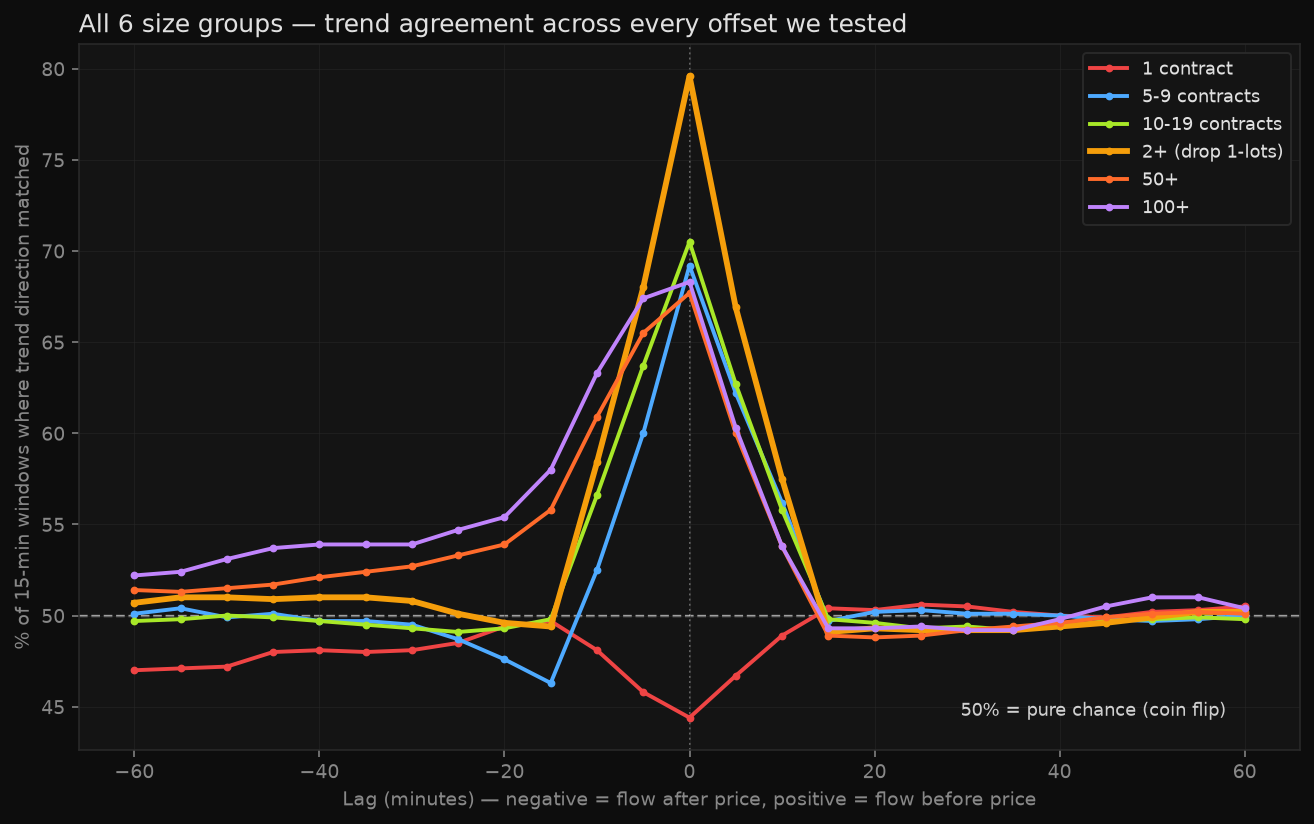
- Nothing predicts price ahead of time. Every size group, measured three different ways, lines up with price at the same moment — never before it.
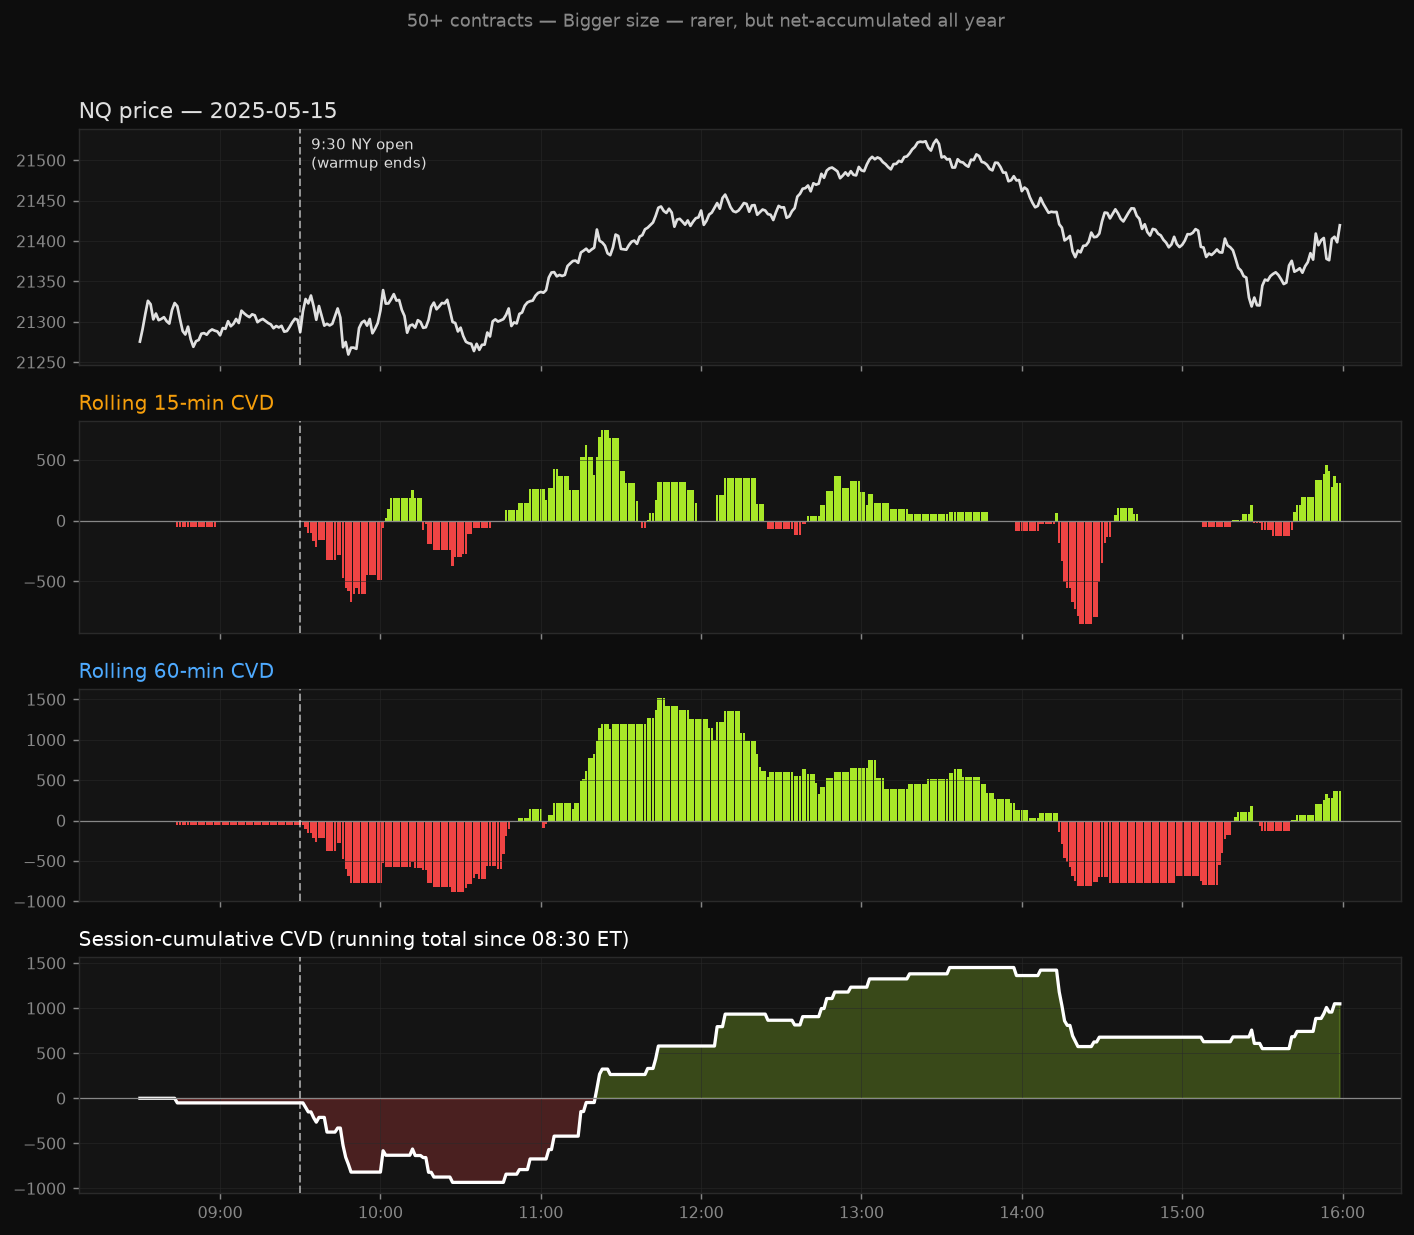
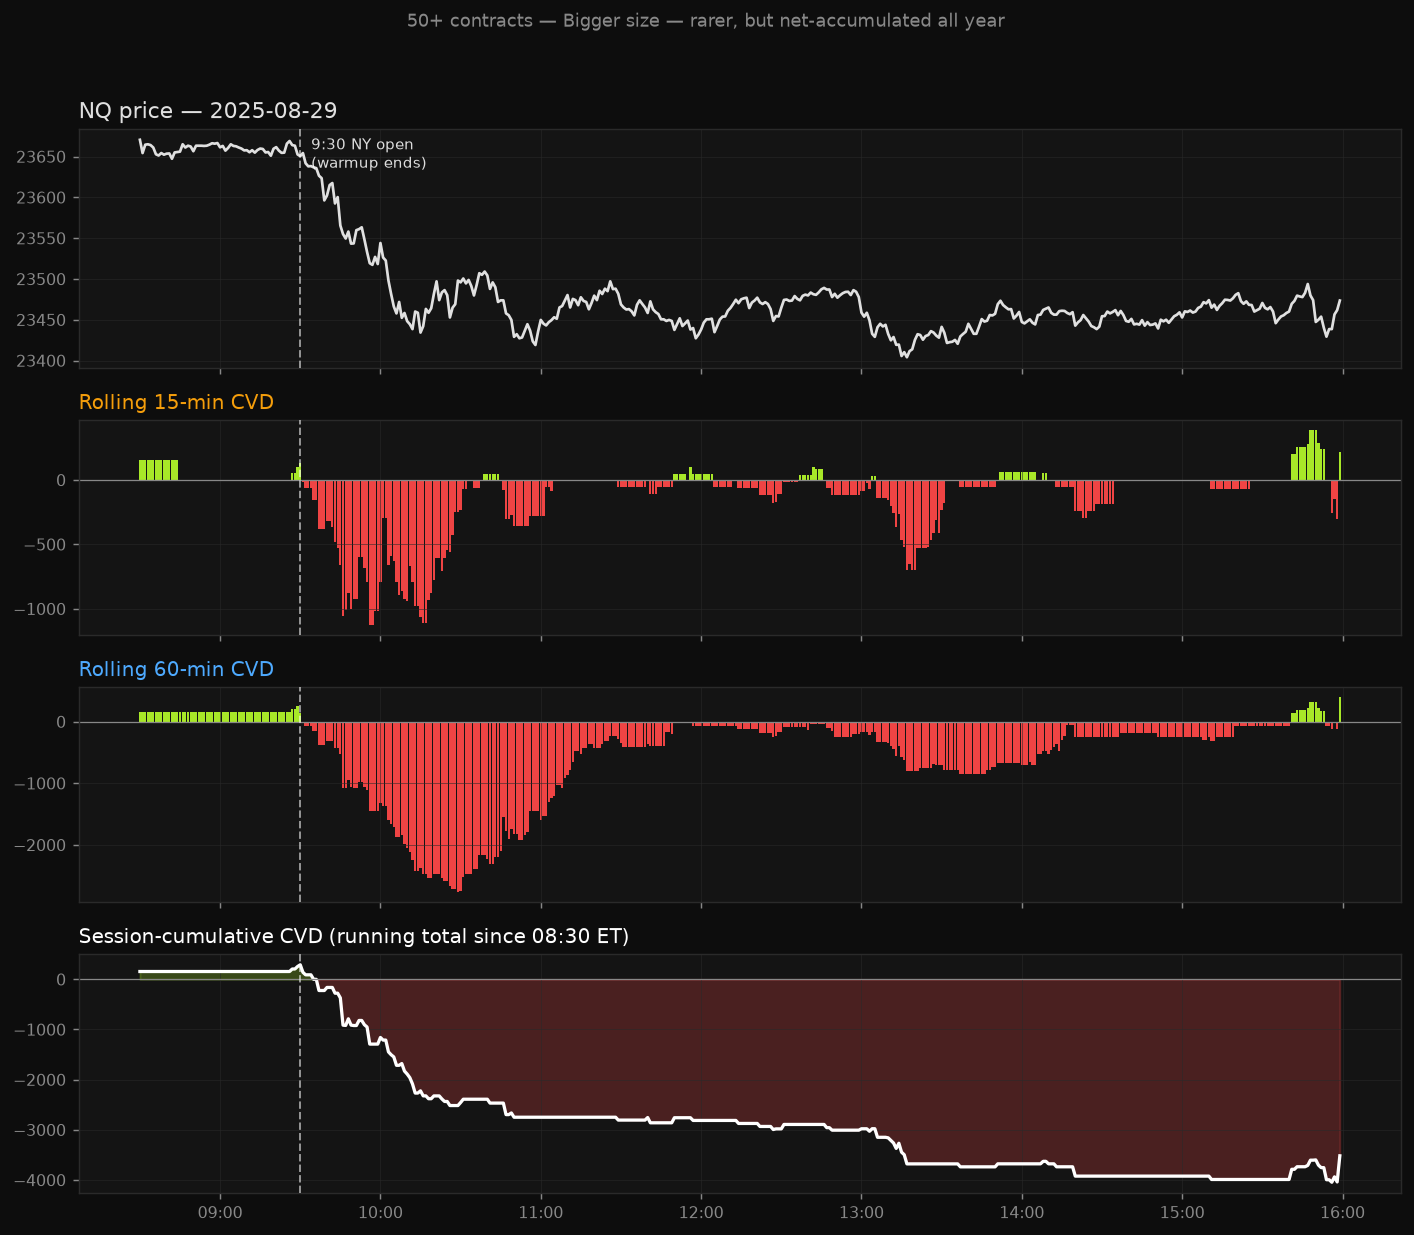
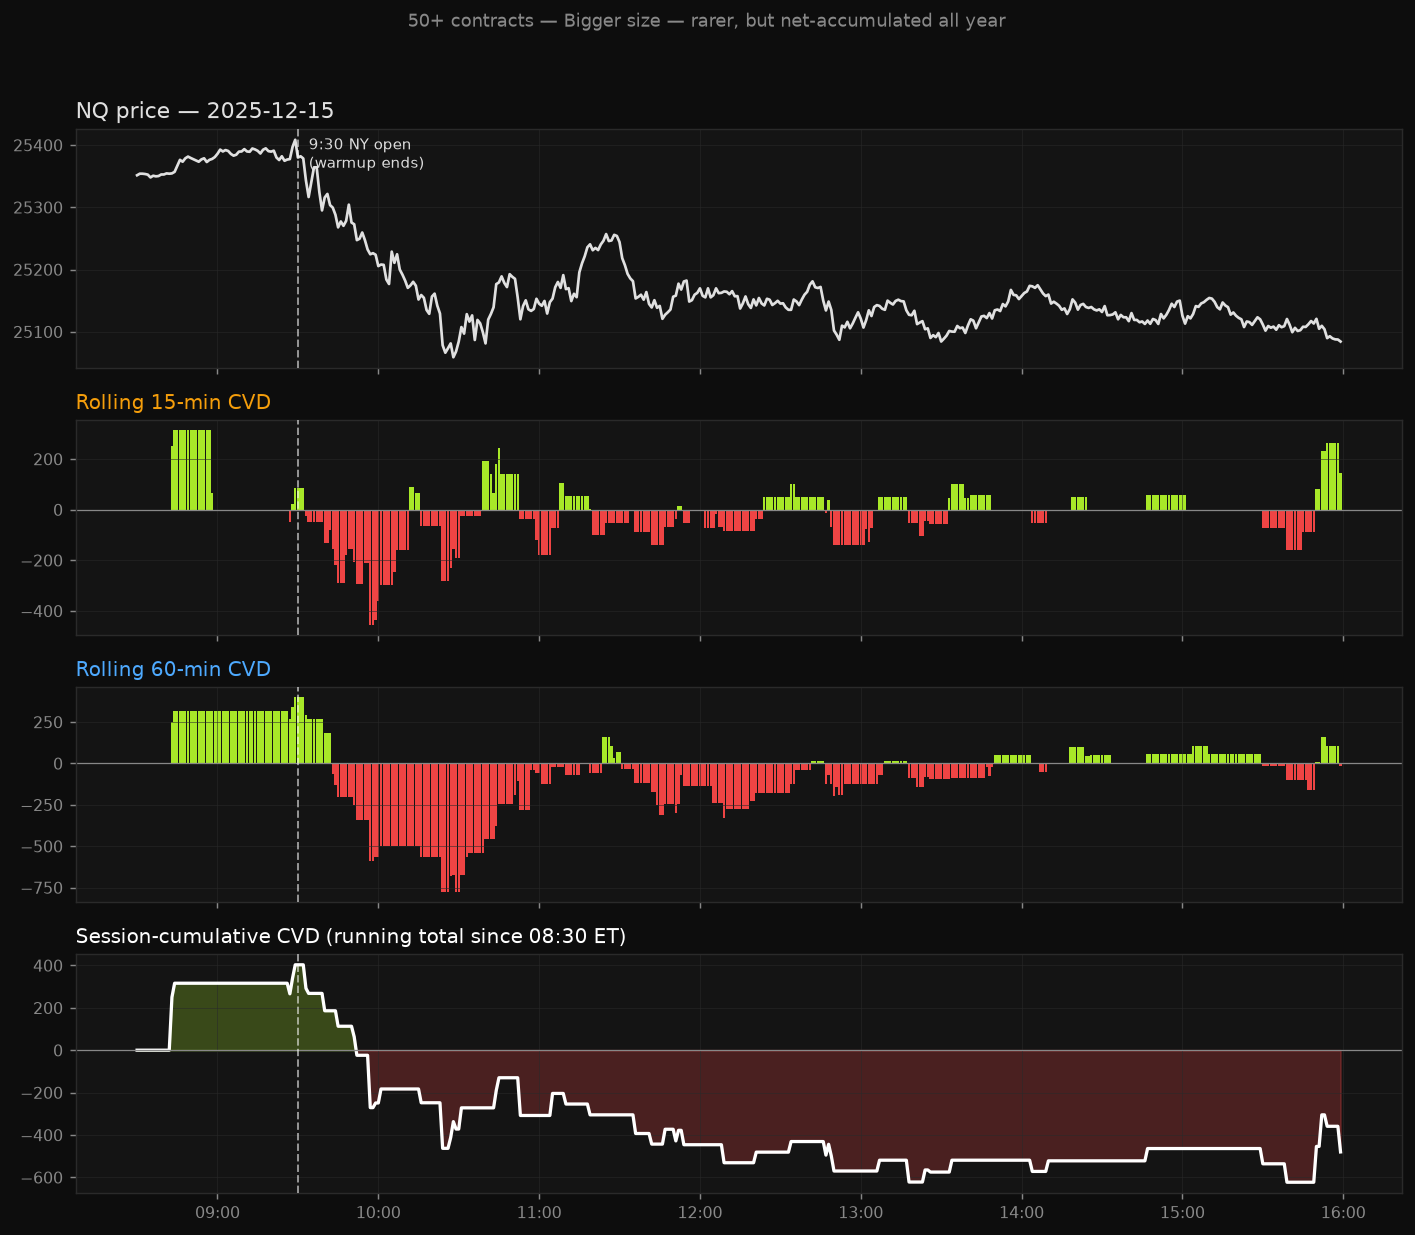
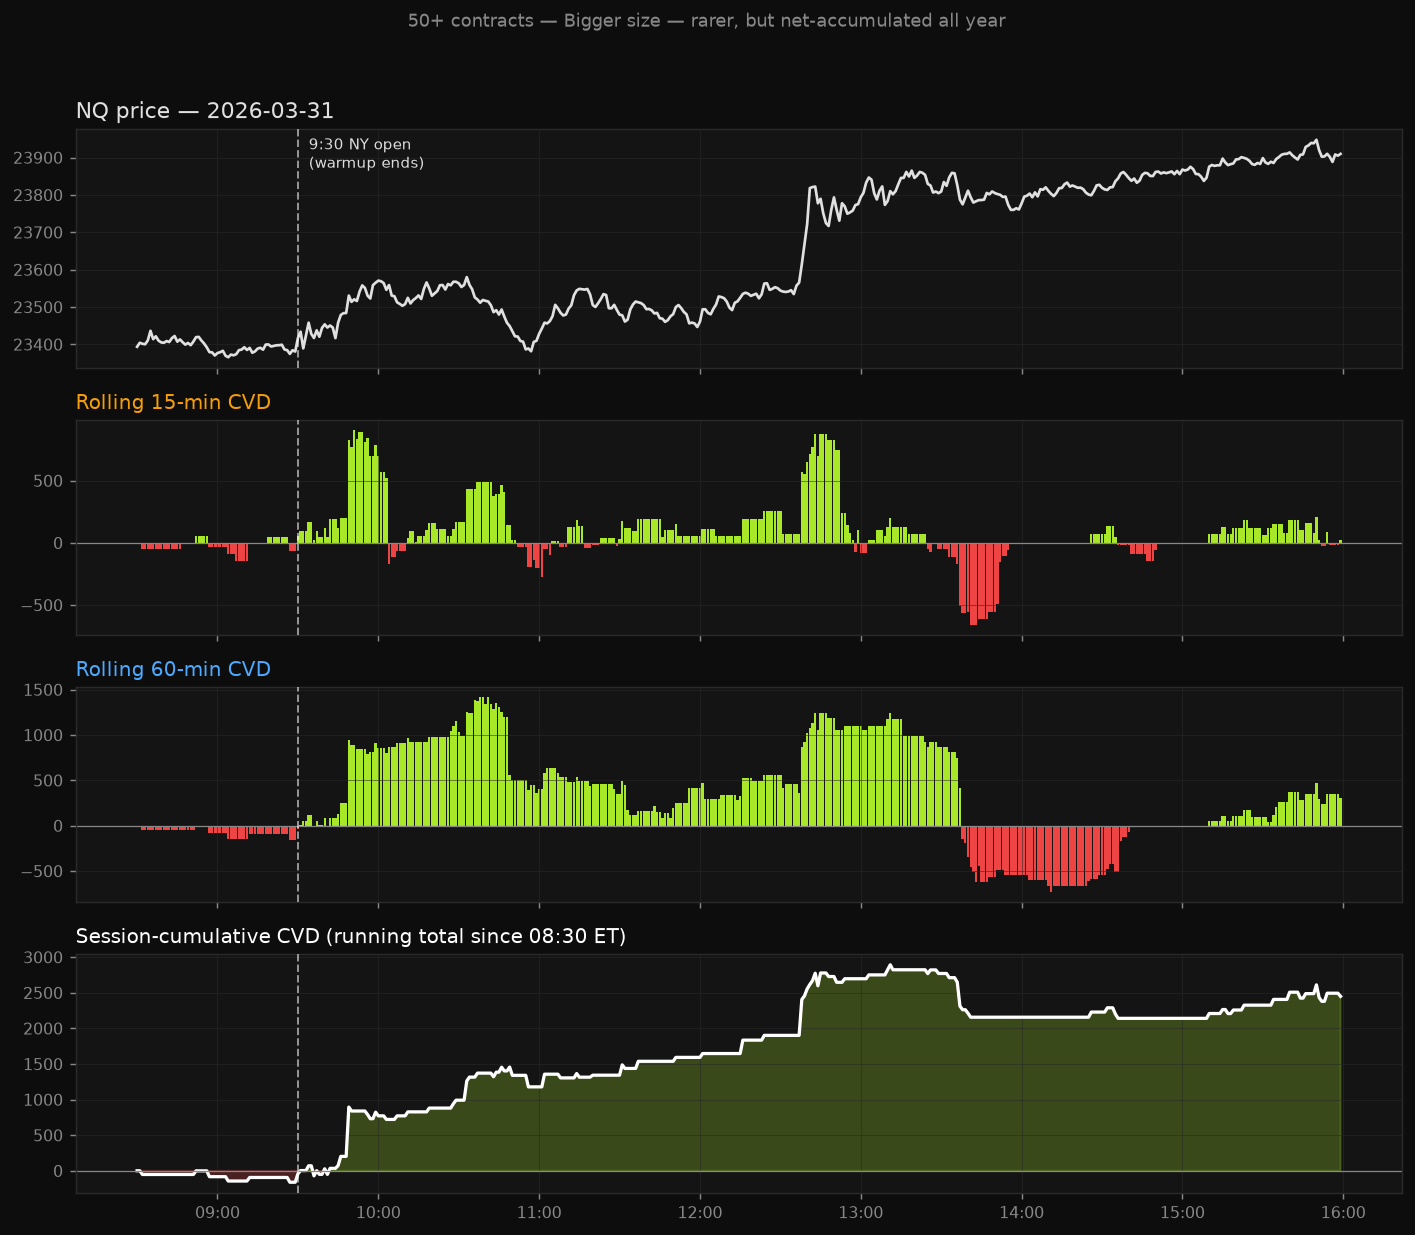
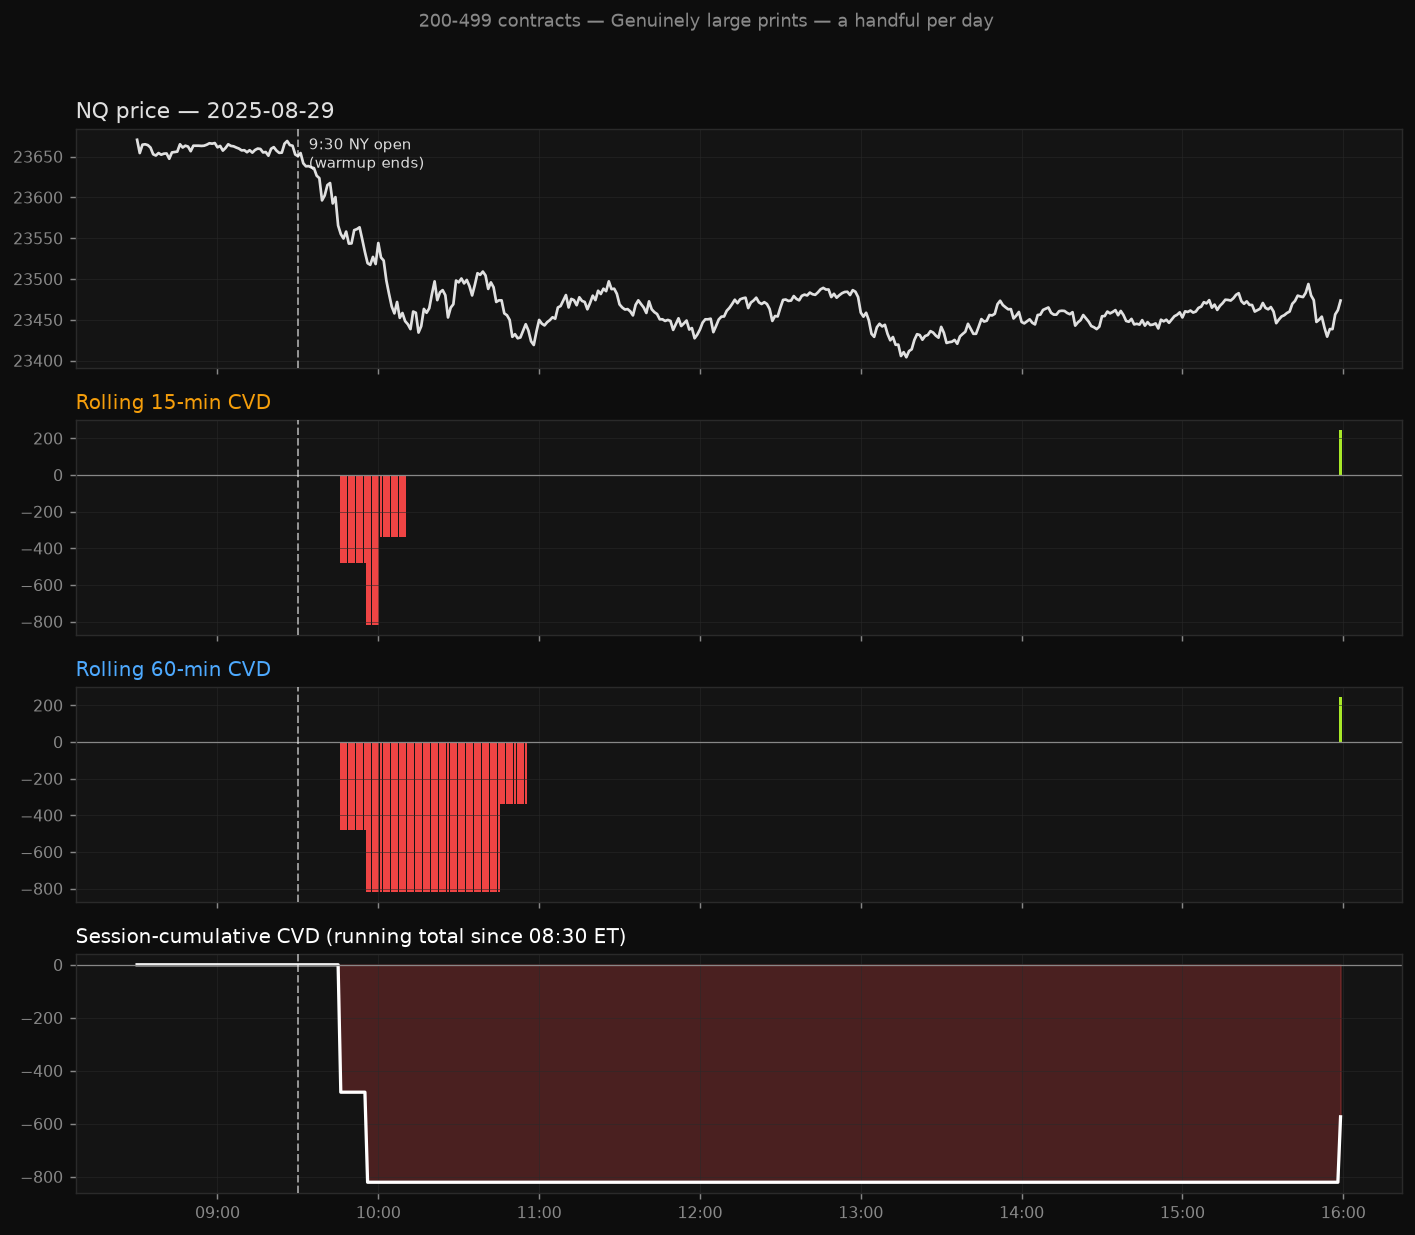
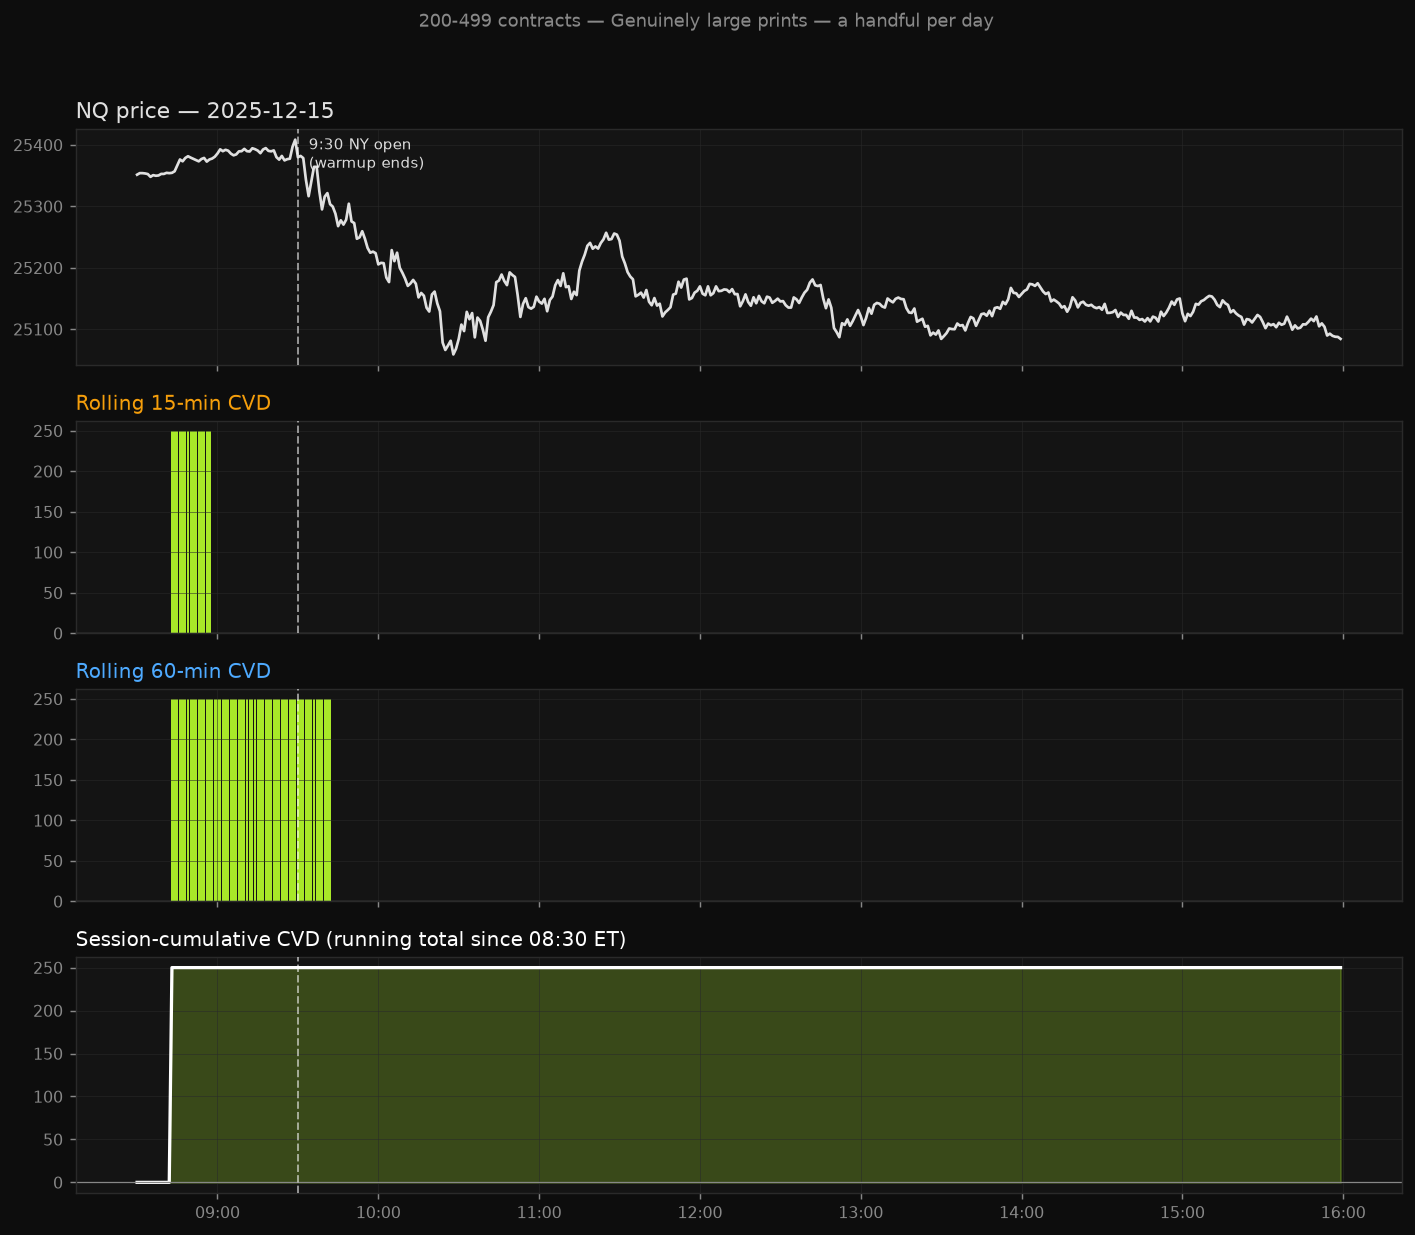
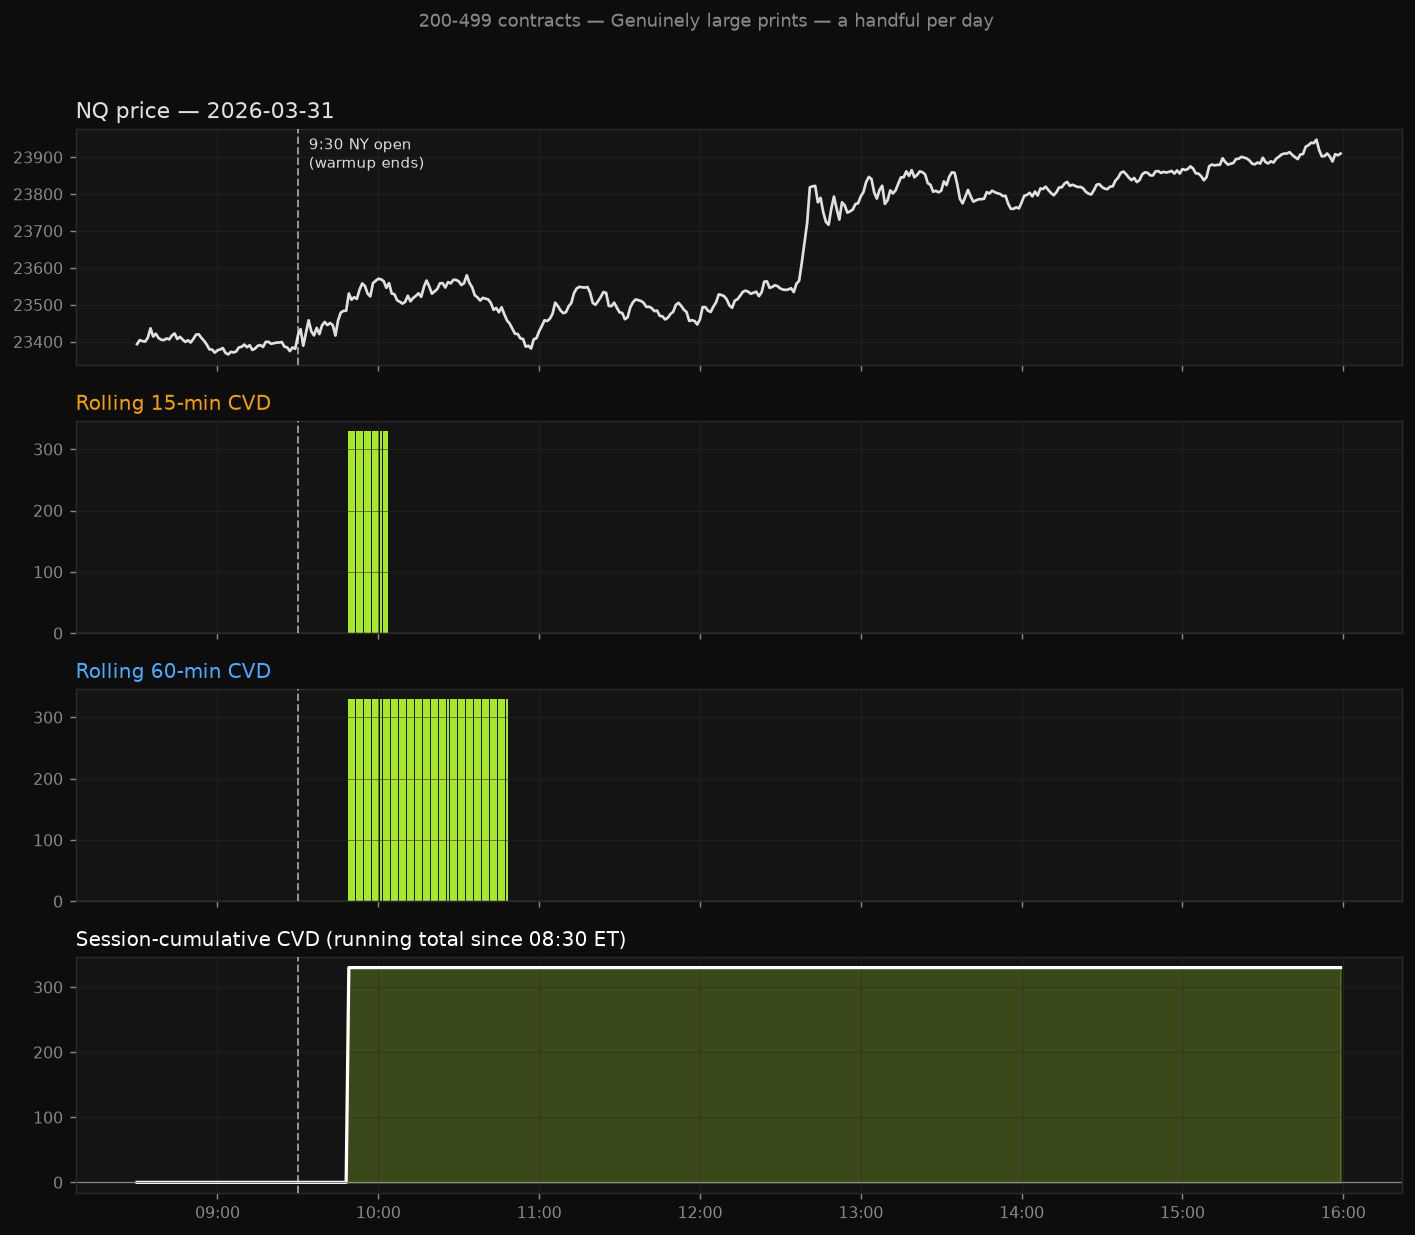
- For rare, big-size trades, watch the running session total, not a short rolling window — there aren't enough of them in any 15 minutes to read cleanly, but they add up to a real signal over the day.
- Over the year, small/mid size (2-49 contracts) was net selling while price rose; 50+ was net buying. Consistent with bigger players accumulating while smaller traders took profits.
- Disagreement between size groups reads price better than either group alone. Small selling while big buys called the direction right ~72% of the time.See "the divergence test" section.
First, the setting that changes everything — Cumulative Trades ON vs OFF
- ATAS's CVD Pro / Multi Market Powers has a checkbox: "Cumulative Trades." We ran this whole study both ways to show why it matters.
- A single large order often hits the tape as several smaller prints, not one.
- ON glues those pieces back into the real trade size (right side below).
- OFF treats every piece as its own tiny trade (left side) — a real 53-lot block trade disappears into 3 unrelated small readings.
See the full ON vs OFF numbers, all 18 size groups ▾
| Bucket | Trades (ON) | Trades (OFF) | Tracks price (ON) | Tracks price (OFF) | Net bias 12mo (ON) | Net bias 12mo (OFF) |
|---|---|---|---|---|---|---|
| 1 contract FLIPS | 42,714,874 | 48,947,634 | -0.22 | +0.10 | +82,208 | -99,342 |
| 2-4 contracts | 13,162,210 | 15,423,262 | +0.29 | +0.61 | -106,035 | -152,504 |
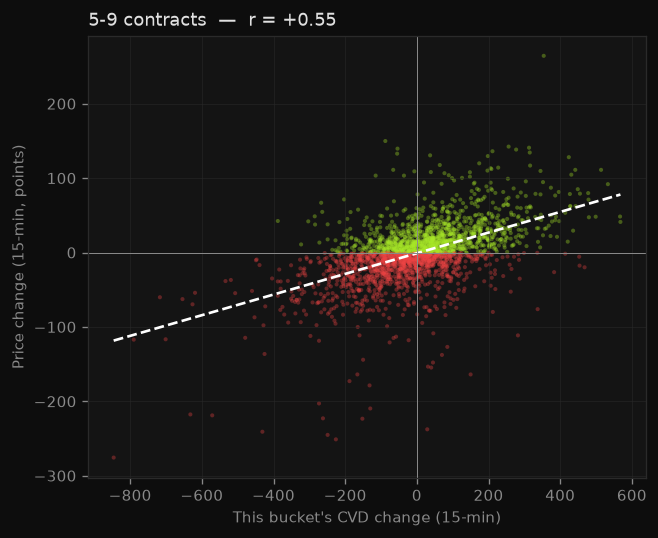
| 5-9 contracts | 1,899,548 | 1,665,606 | +0.55 | +0.58 | +10,481 | +84,829 |
| 10-19 contracts FLIPS | 543,386 | 144,028 | +0.56 | +0.52 | -79,320 | +44,413 |
| 20-49 contracts | 157,974 | 26,067 | +0.47 | +0.22 | -85,079 | -1,113 |
| 50-99 contracts | 26,475 | 3,646 | +0.36 | +0.07 | +506 | +4,589 |
| 100-199 contracts | 5,992 | 950 | +0.31 | +0.08 | +40,679 | +6,232 |
| 200-499 contracts | 1,395 | 259 | +0.17 | +0.08 | +37,068 | +19,057 |
| 500+ contracts | 108 | 53 | +0.10 | +0.08 | +18,703 | +13,050 |
| 1+ (everyone) | 58,511,962 | 66,211,505 | +0.68 | +0.68 | -80,789 | -80,789 |
| 2+ (drop 1-lots) FLIPS | 15,797,088 | 17,263,871 | +0.72 | +0.68 | -162,997 | +18,553 |
| 5+ FLIPS | 2,634,878 | 1,840,609 | +0.70 | +0.57 | -56,962 | +171,057 |
| 10+ FLIPS | 735,330 | 175,003 | +0.64 | +0.39 | -67,443 | +86,228 |
| 20+ | 191,944 | 30,975 | +0.54 | +0.21 | +11,877 | +41,815 |
| 50+ | 33,970 | 4,908 | +0.43 | +0.14 | +96,956 | +42,928 |
| 100+ | 7,495 | 1,262 | +0.31 | +0.12 | +96,450 | +38,339 |
| 200+ | 1,503 | 312 | +0.19 | +0.10 | +55,771 | +32,107 |
| 500+ | 108 | 53 | +0.10 | +0.08 | +18,703 | +13,050 |
One more thing before the findings — what does a "correlation" number mean?
You'll see numbers like +0.72 or -0.22 throughout what follows — a correlation, on a scale from -1 to +1:
- +0.72 means: net buying tends to line up with price going up at the same time (and net selling with price going down).
- It does not mean this group predicts price — and it's not a percentage or a win rate.
- Below, we don't just give you the number — we show you what it looks like.
Does the flow actually track price? — see it, don't just take our word
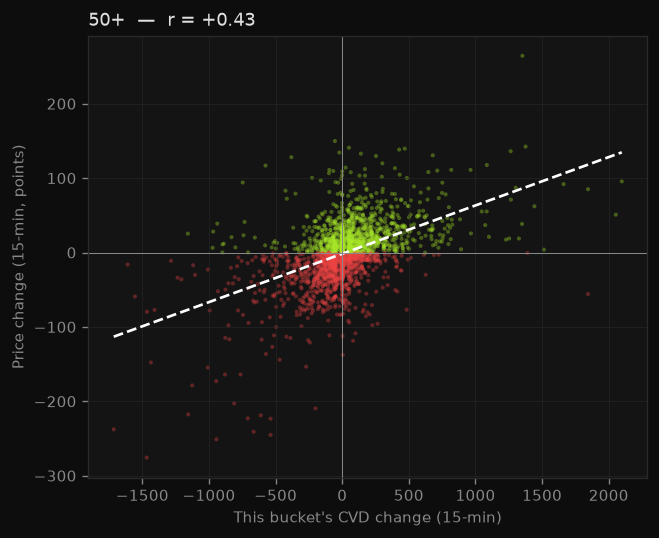
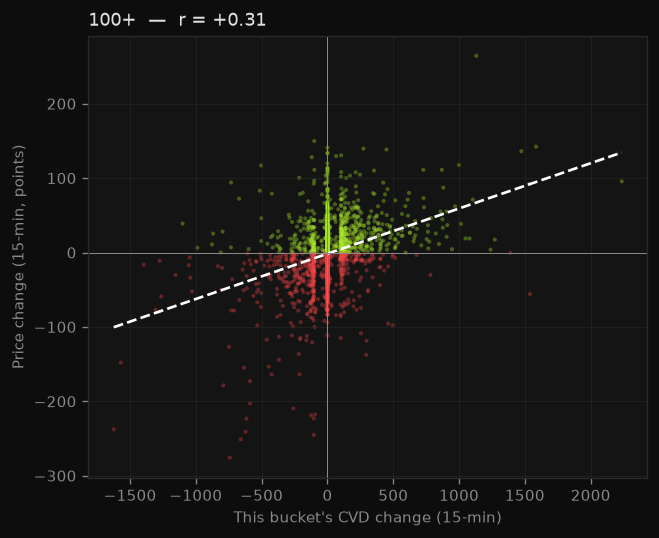
- Scatter dot = one 15-minute stretch. Left/right = how much that group bought or sold; up/down = what price did over that same 15 minutes.
- Cloud leaning bottom-left to top-right = a relationship you can see with your own eyes.
- Gauge = a simpler, different measure of the same thing: out of every 15-minute stretch, what % of the time did direction actually match price?
- The percentage won't equal the r-value — r factors in how big each move was, the percentage only counts direction — but a strong r and a high percentage move together, as you'll see below.
Which size range works best on its own — the sweet spot
Each size range tested alone, three ways: the same trailing 15-minute window used everywhere else in this report, a slower 60-minute window, and the running session total. Longer bar = tighter relationship to price.
The best practical filter — what to actually watch
Set a minimum size, count everything above it. "5+" = every trade of 5+ contracts, summed together. Same three windows as above: 15-min, 60-min, session total.
Does any size see the future? — leading vs. lagging, and how far we looked
- This is trend vs. trend, not instant vs. instant.
- Compares net buying/selling over a trailing 15-minute stretch to price's move over that same stretch.
- Slid that comparison from 60 min before to 60 min after, one minute at a time, to check every other offset.
- Below: all 6 size groups, plotted continuously from -60 to +60 minutes, not just a few points.
- Each line = % of 15-min windows where that bucket's trend matched price's trend, at that offset.
- Dashed line at 50% = coin flip, no relationship at all.
See the same-window agreement % and points-per-100-contracts ratio for all 6 size groups ▾
| Bucket | Same-window agreement | Price move per 100 contracts |
|---|---|---|
| 1 contract | 44% | -3.9 pts |
| 5-9 contracts | 69% | +13.8 pts |
| 10-19 contracts | 70% | +13.8 pts |
| 2+ (drop 1-lots) | 80% | +4.8 pts |
| 50+ | 68% | +5.8 pts |
| 100+ | 68% | +5.3 pts |
"5-9" and "10-19" move price more per contract (+13.8 pts/100) than "2+" (+4.8 pts/100) — even though "2+" has the higher agreement %. "2+" is more reliable (far more volume); 5-19 lot trades carry more price impact per contract. Two different questions, one table.
Two ways to watch this — running session total vs. a rolling window
- Session total = running tally since the 08:30 ET open.
- Rolling 15/60-min = only a recent window, resetting constantly.
- Common trade sizes: barely matters which you use. Rare/big sizes: matters a lot.
See the full session vs. rolling numbers, all 18 size groups ▾
| Bucket | Session total | Rolling 15-min | Rolling 60-min |
|---|---|---|---|
| 1 contract GAP | -0.44 | -0.22 | -0.24 |
| 2-4 contracts | +0.20 | +0.29 | +0.21 |
| 5-9 contracts | +0.51 | +0.55 | +0.50 |
| 10-19 contracts | +0.53 | +0.56 | +0.54 |
| 20-49 contracts | +0.50 | +0.47 | +0.48 |
| 50-99 contracts GAP | +0.54 | +0.36 | +0.42 |
| 100-199 contracts GAP | +0.57 | +0.31 | +0.42 |
| 200-499 contracts GAP | +0.33 | +0.17 | +0.22 |
| 500+ contracts GAP | +0.22 | +0.10 | +0.13 |
| 1+ (everyone) | +0.64 | +0.68 | +0.66 |
| 2+ (drop 1-lots) | +0.75 | +0.72 | +0.71 |
| 5+ | +0.75 | +0.70 | +0.71 |
| 10+ | +0.72 | +0.64 | +0.67 |
| 20+ GAP | +0.69 | +0.54 | +0.60 |
| 50+ GAP | +0.63 | +0.43 | +0.51 |
| 100+ GAP | +0.53 | +0.31 | +0.40 |
| 200+ GAP | +0.35 | +0.19 | +0.25 |
| 500+ GAP | +0.22 | +0.10 | +0.13 |
Who was actually buying and selling this year
NQ rose about 6,525 points over the 12 months tested. Net buying vs. selling by size group, same window:
| Bucket | Net over 12 months |
|---|---|
| 1 contract | +82,208 (net buying) |
| 2-4 contracts | -106,035 (net selling) |
| 5-9 contracts | +10,481 (net buying) |
| 10-19 contracts | -79,320 (net selling) |
| 20-49 contracts | -85,079 (net selling) |
| 50-99 contracts | +506 (net buying) |
| 100-199 contracts | +40,679 (net buying) |
| 200-499 contracts | +37,068 (net buying) |
| 500+ contracts | +18,703 (net buying) |
When size groups disagree — the divergence test
- Every finding so far looked at one size group at a time. This tests what happens when two disagree.
- Paired 1 contract (works against price alone, r=-0.23) against 50+ (works with price alone, r=+0.44) — the two buckets that already behave the most differently.
- Split every 15-minute window into 4 states by what each group was doing, then checked what price did in that same window.
Does this hold up at the open too?
Split the same 4 states into the first 90 minutes of RTH (9:30-11:00 ET) vs. the rest of the session, to check whether the read changes at the open.
20 real examples — see it for yourself
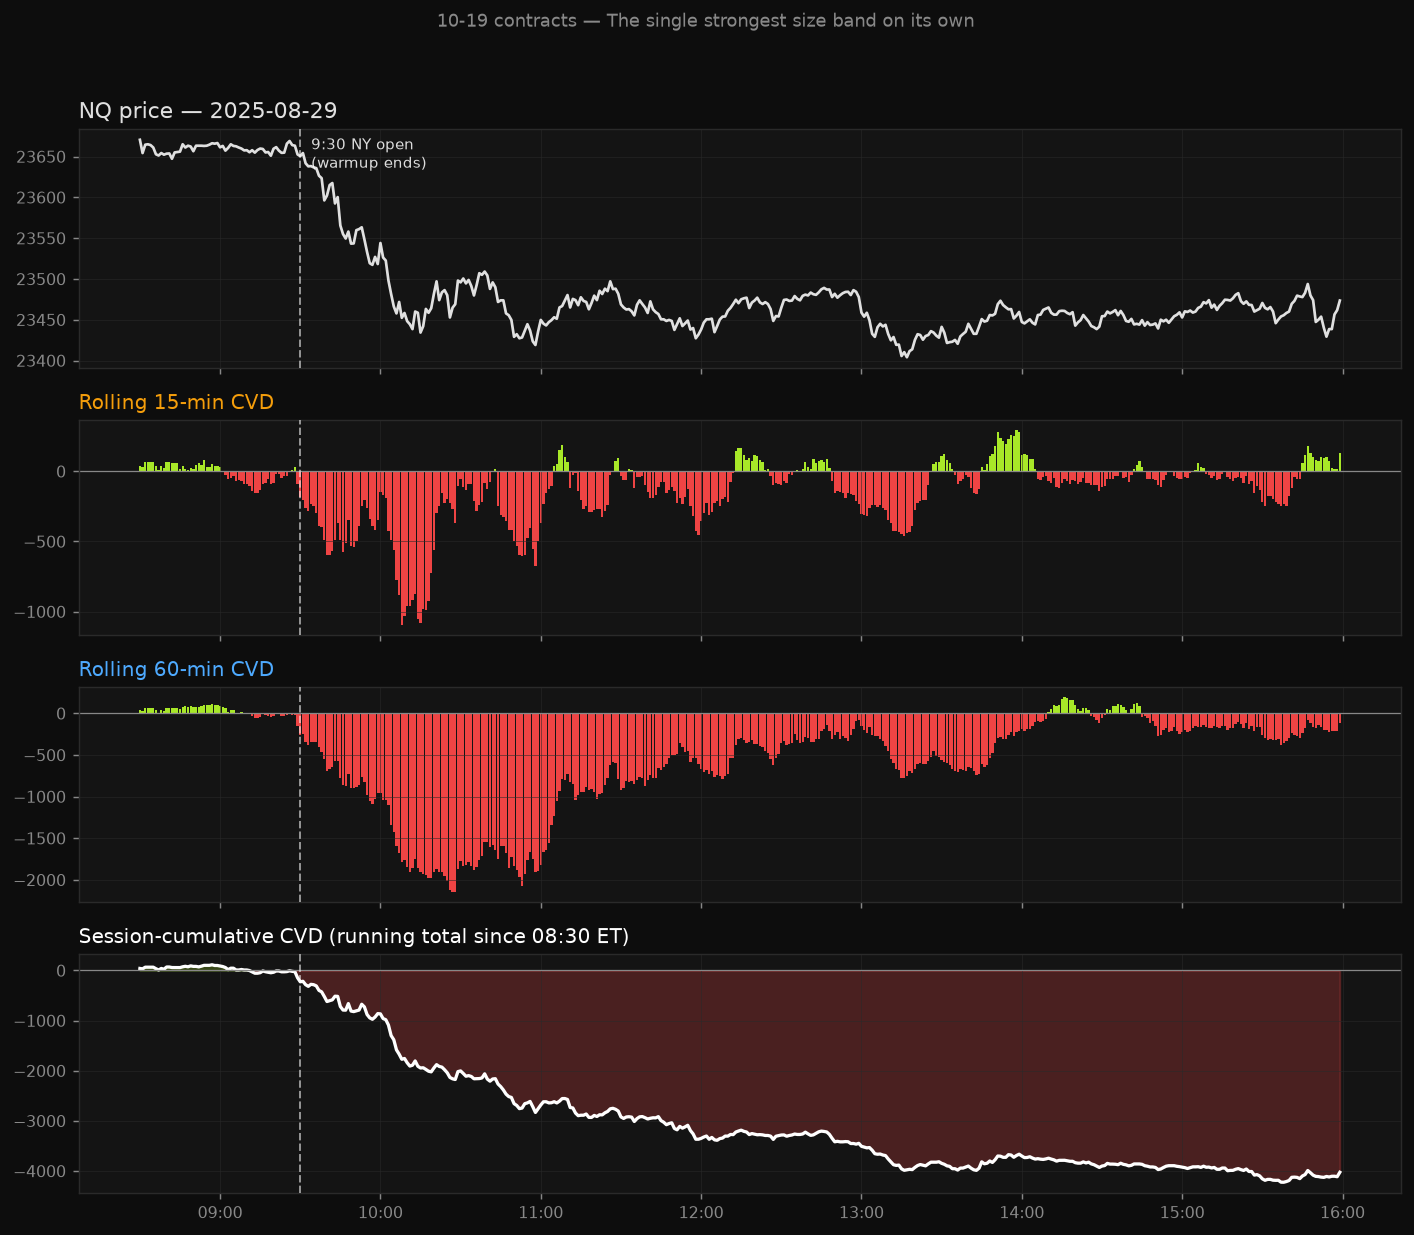
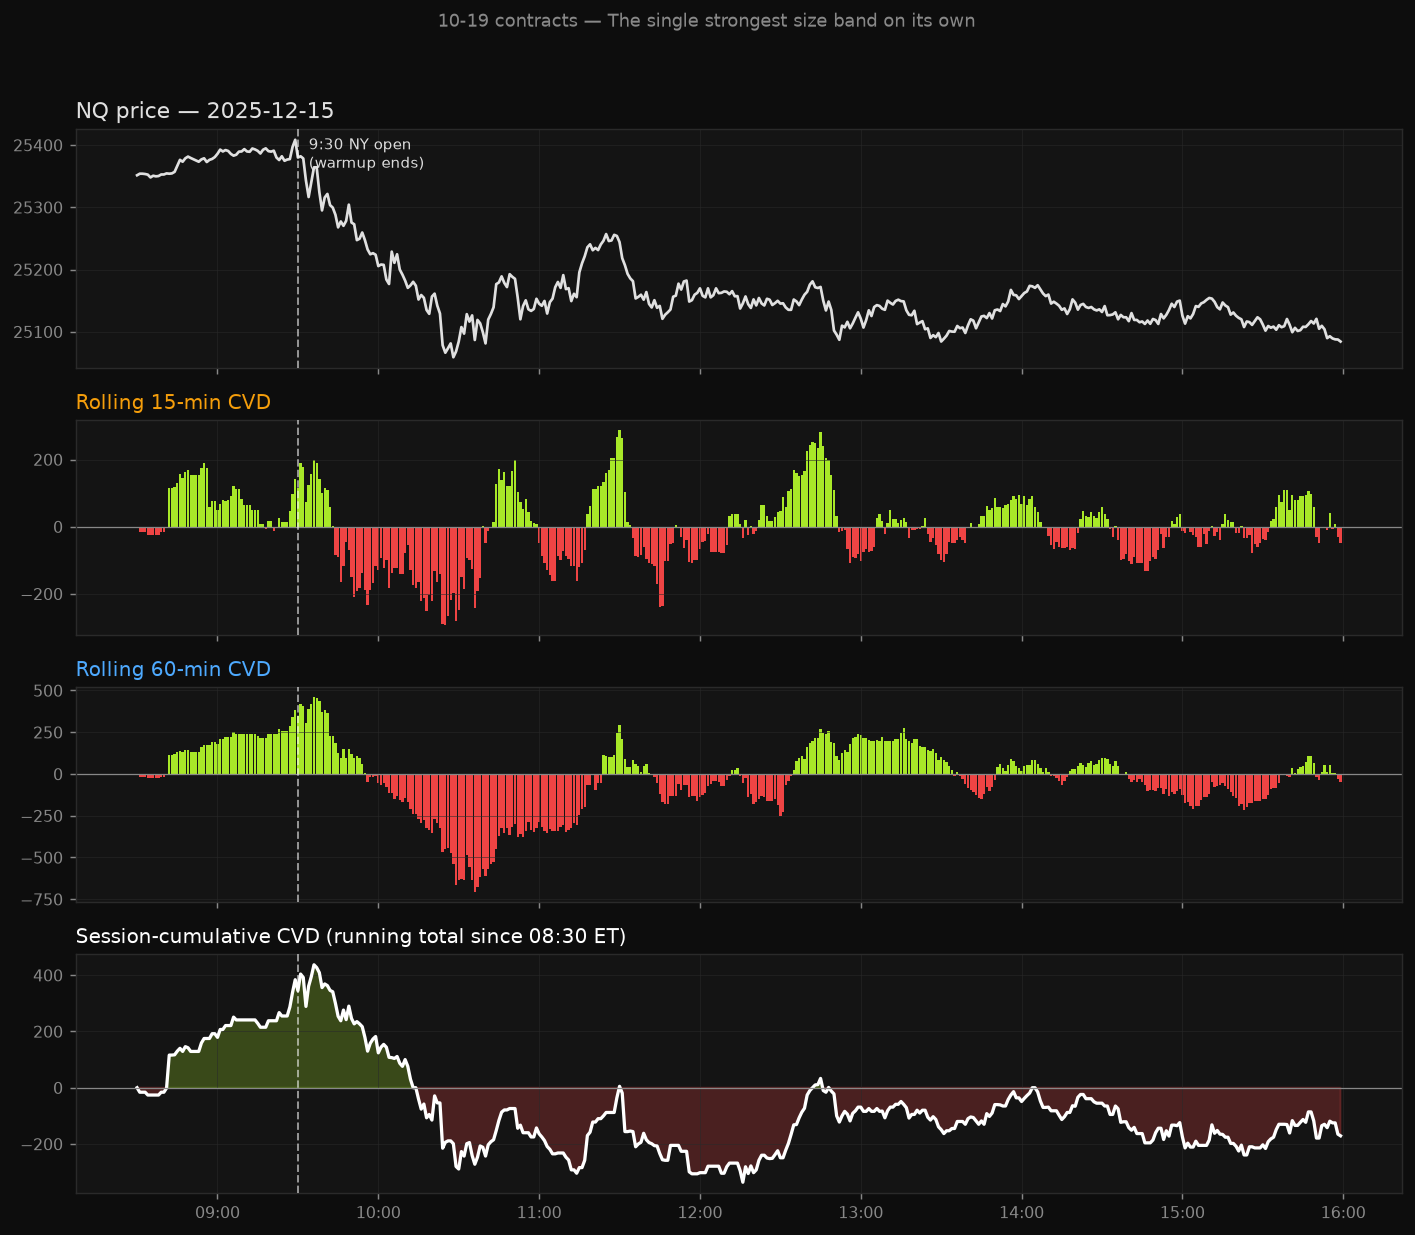
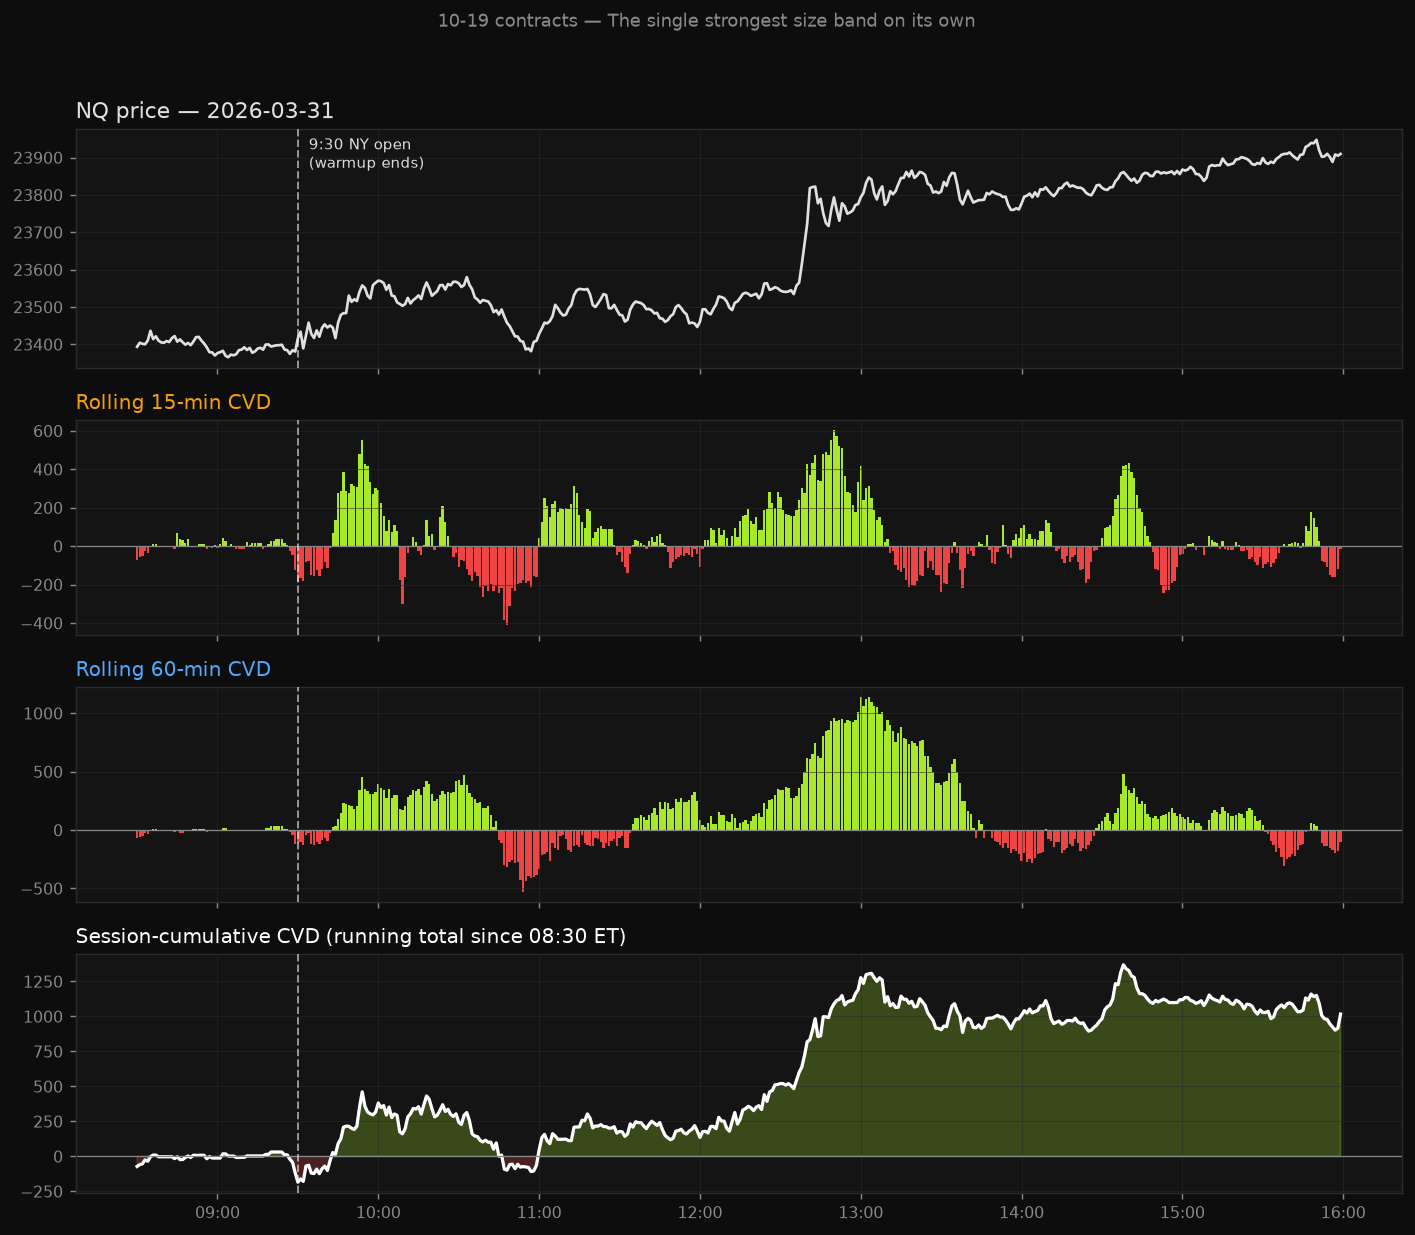
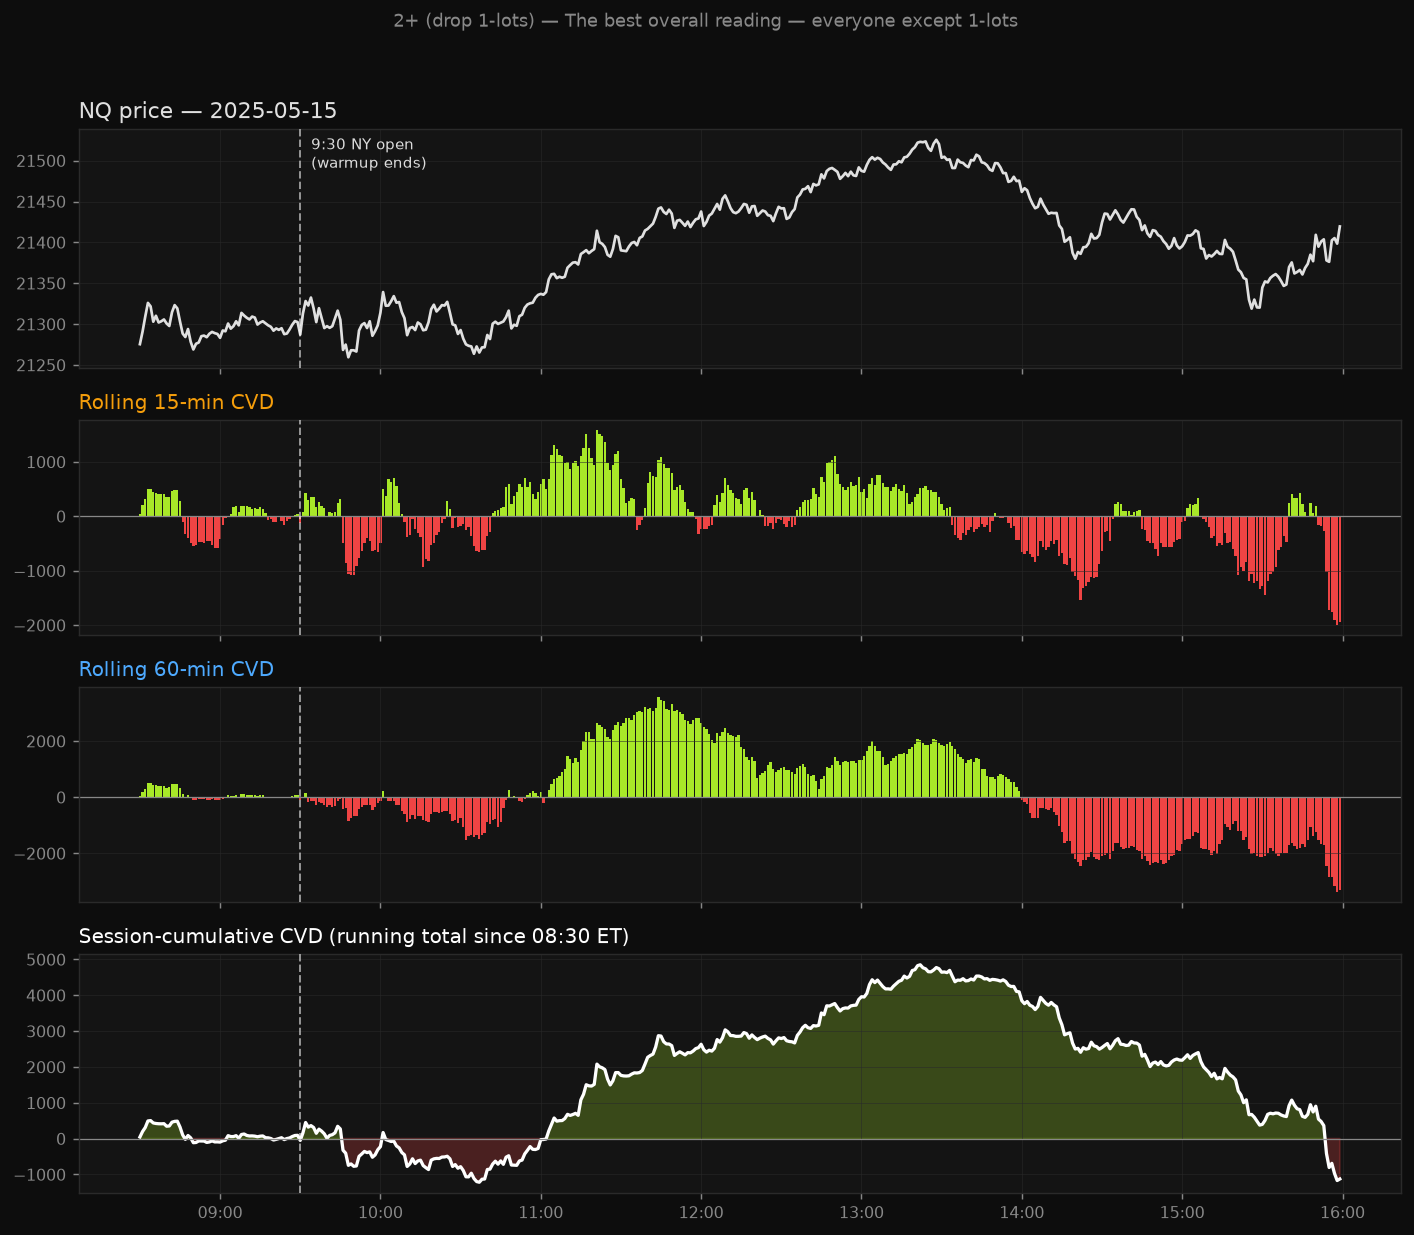
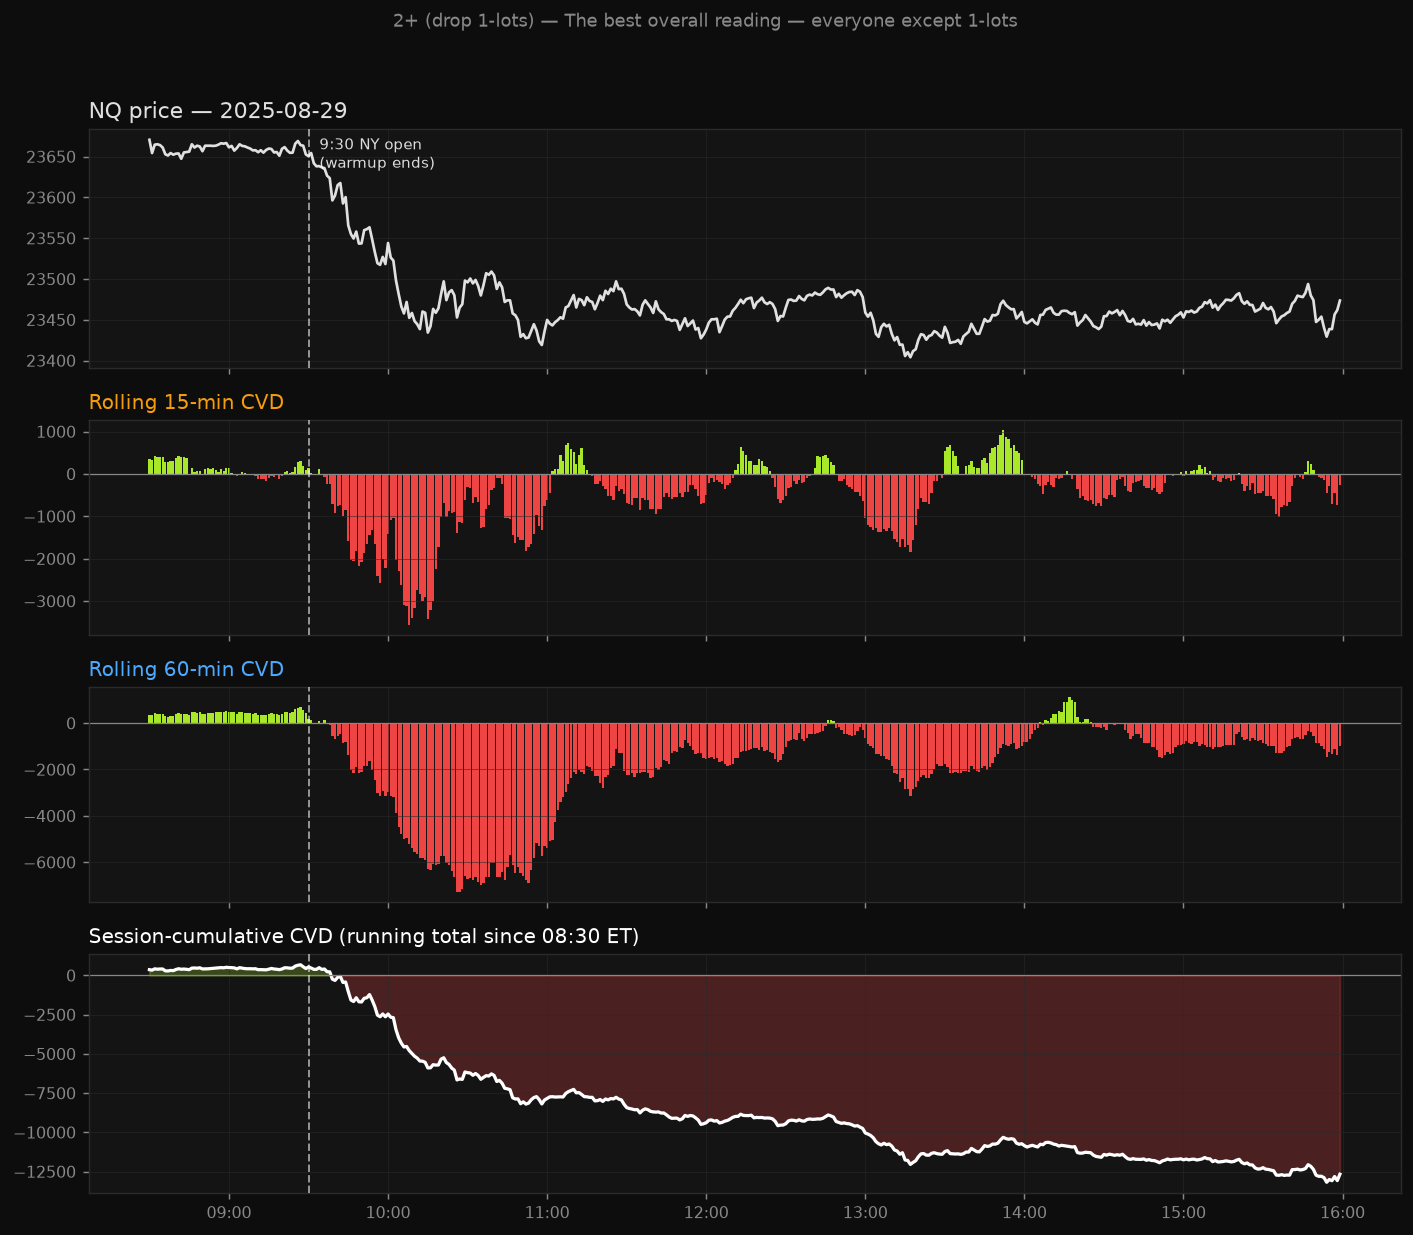
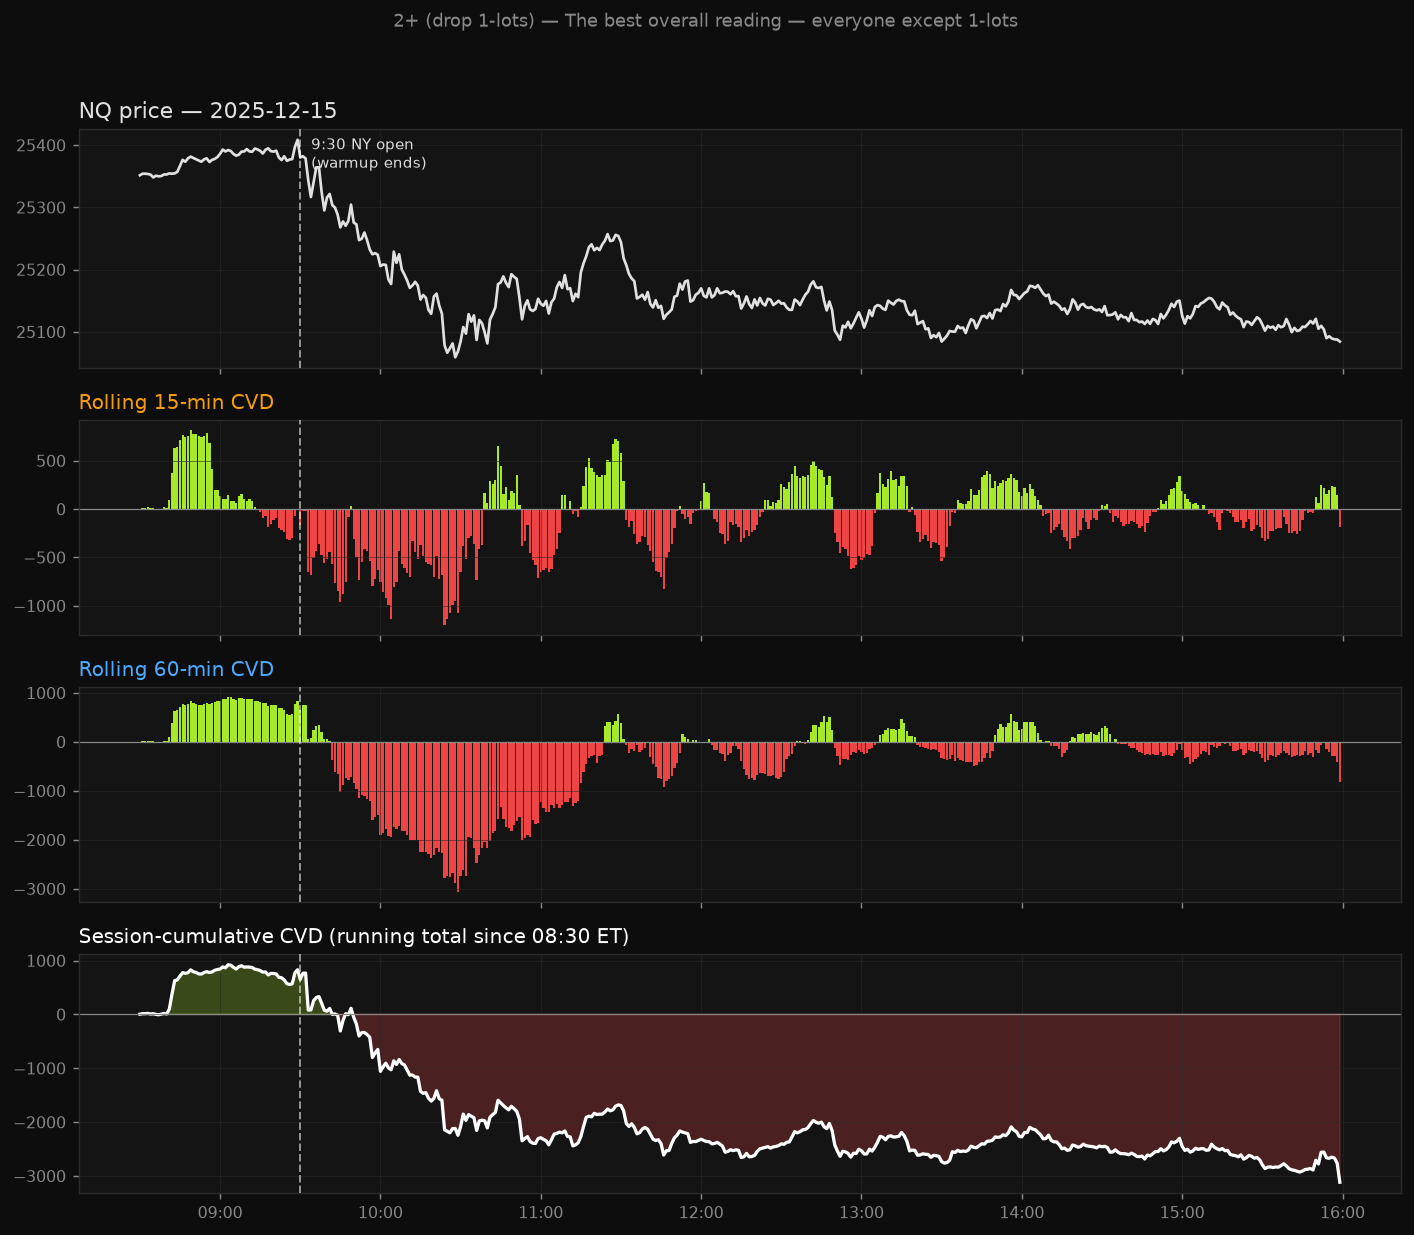
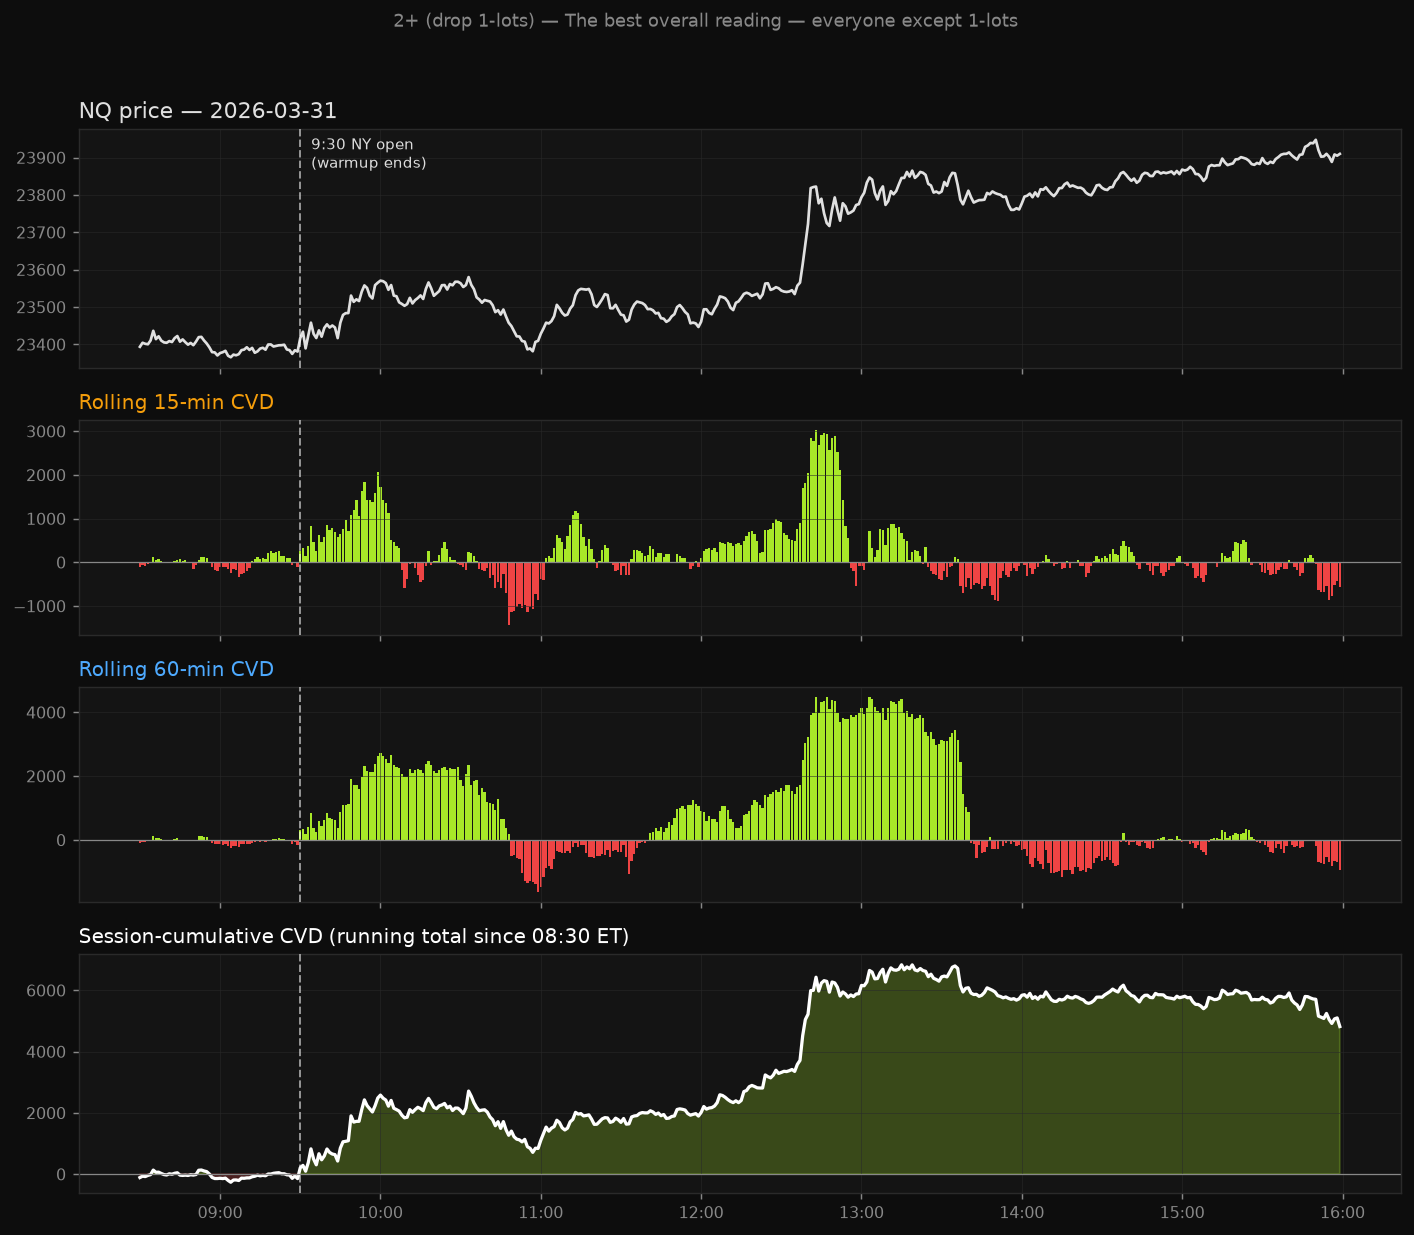
- 4 real trading days × 5 size filters.
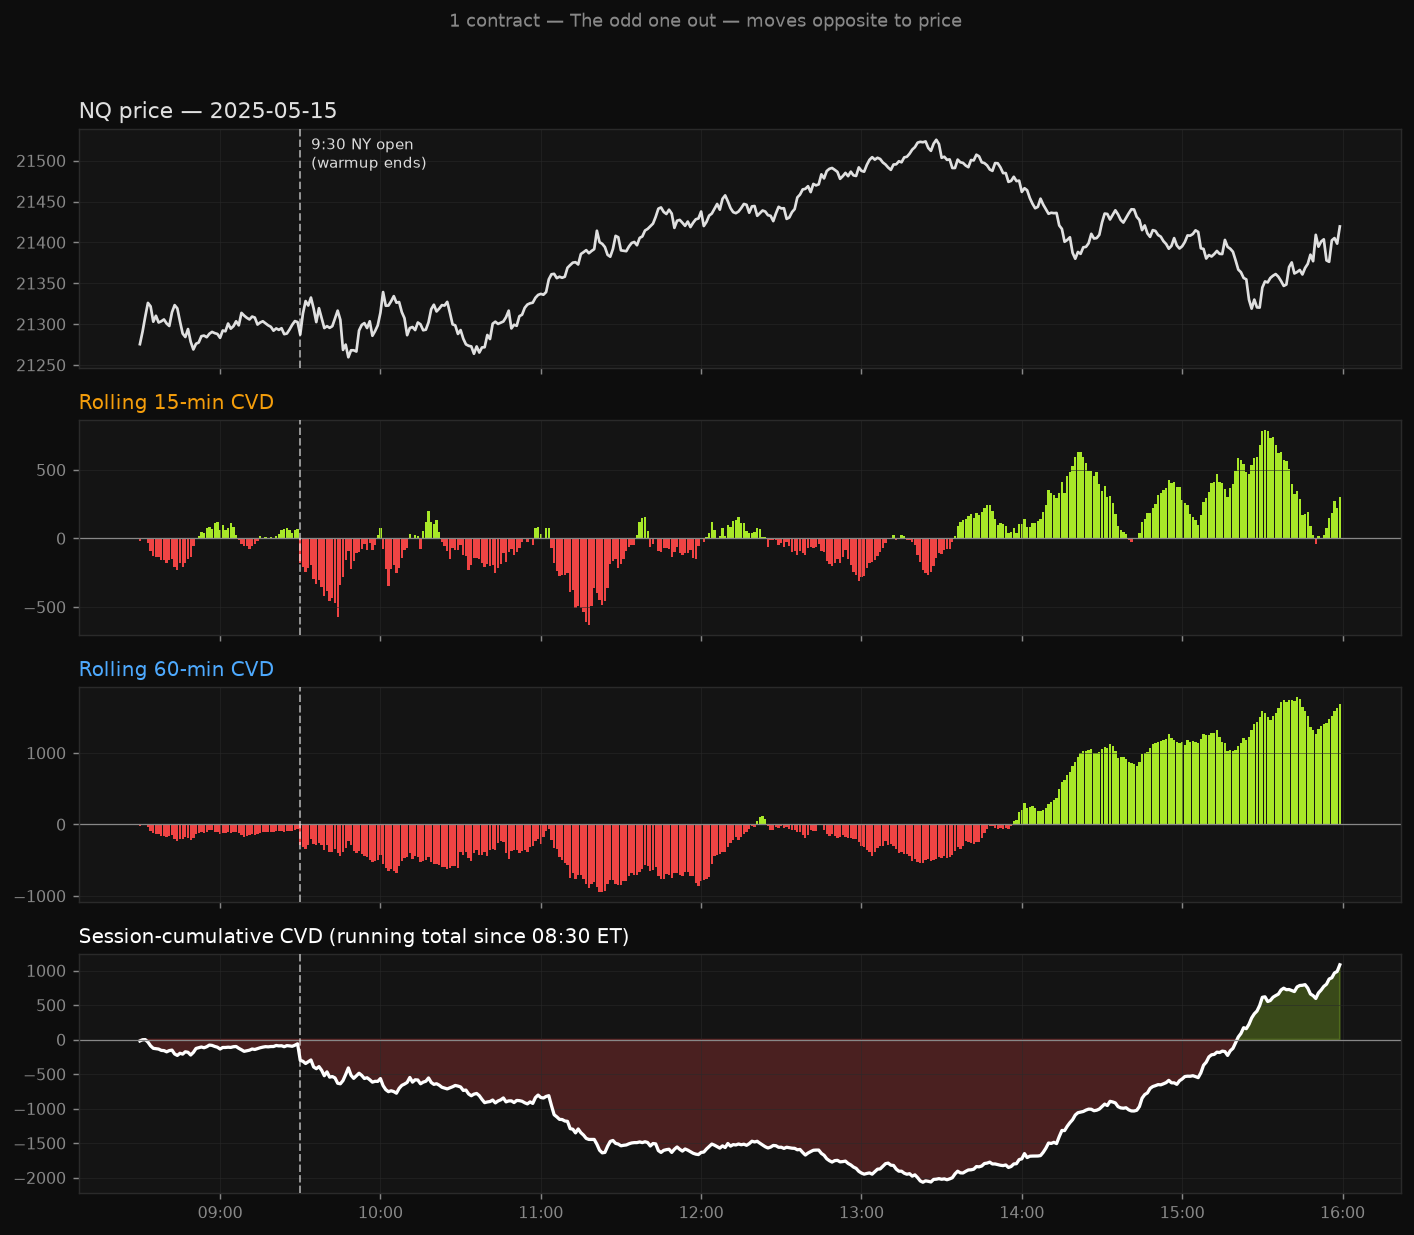
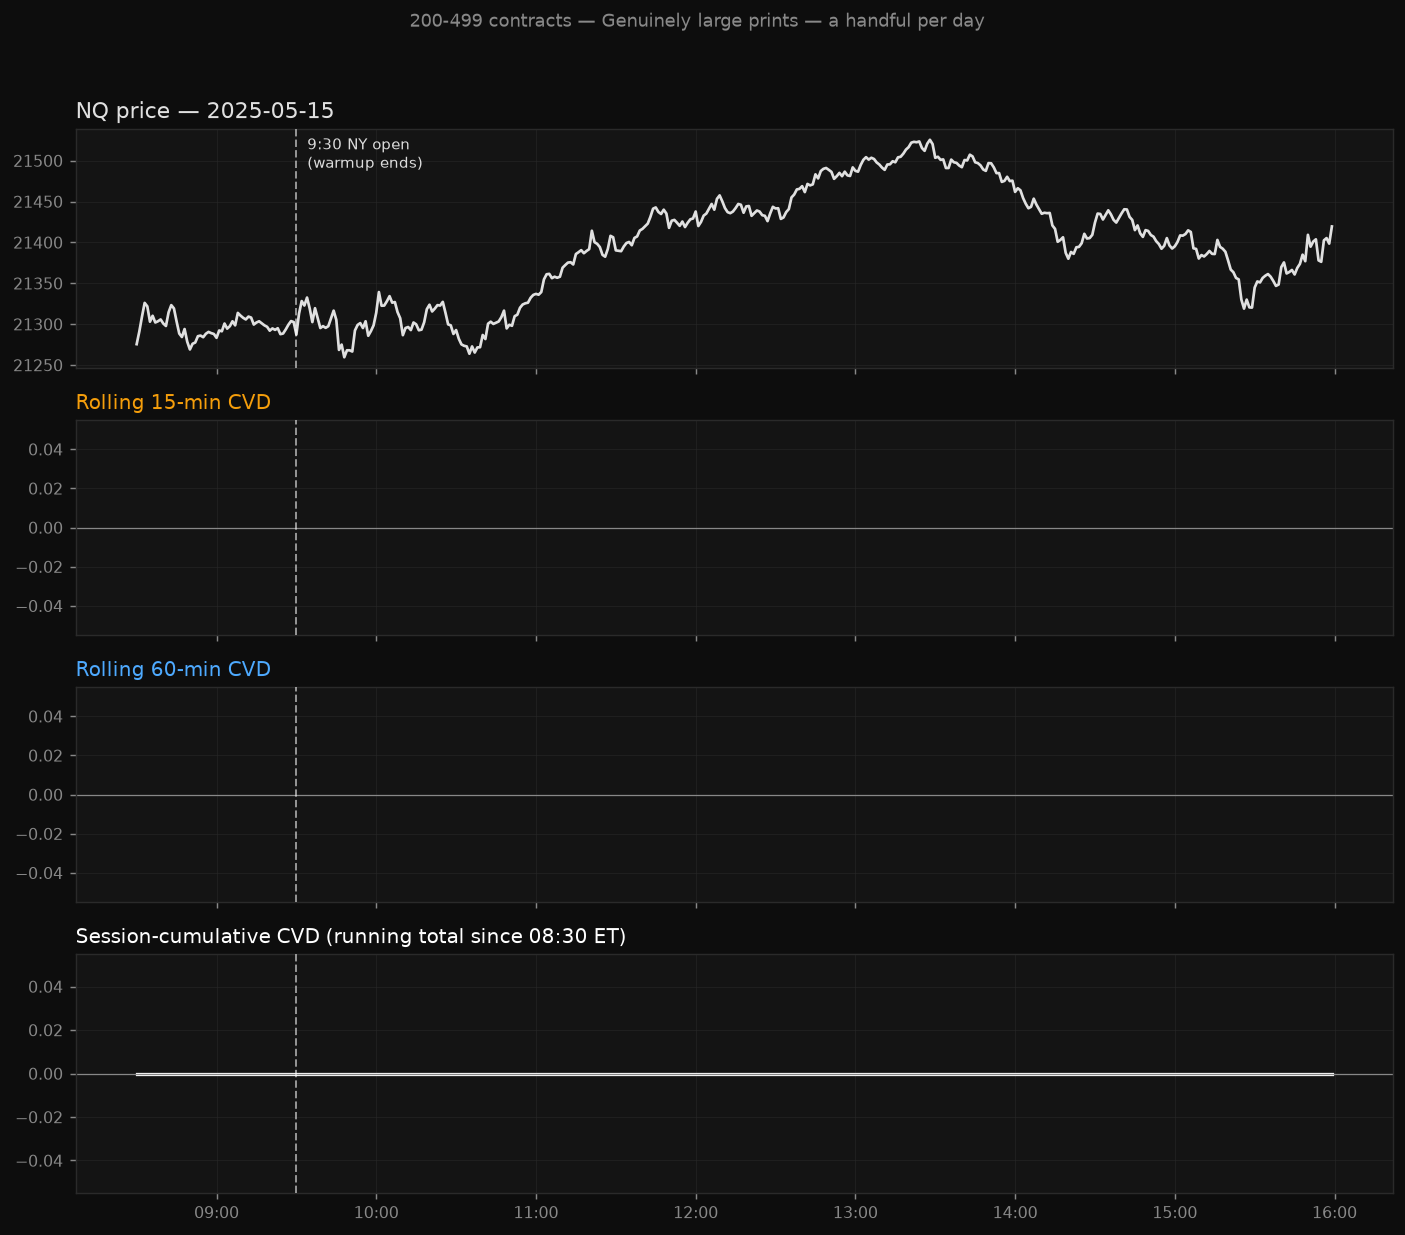
- Each chart stacks all 3 readings under price: rolling 15-min, rolling 60-min, session-cumulative.
- Click any chart to enlarge. Click a group below to expand.
1 contract — The odd one out — moves opposite to price
10-19 contracts — The single strongest size band on its own
2+ (drop 1-lots) — The best overall reading — everyone except 1-lots
50+ contracts — Bigger size — rarer, but net-accumulated all year
200-499 contracts — Genuinely large prints — a handful per day
How to actually use this
- Turn Cumulative Trades ON in ATAS's CVD Pro / Multi Market Powers, or any custom version you build.
- Don't chase the biggest prints expecting an edge — 200+ and 500+ contract trades are rare and, on their own, one of the weakest trackers of price minute to minute.
- The 5-20 contract range is the sweet spot if you want to watch one size band closely.
- If you want one simple filter, use "everything except 1-lots."
- Use the running session total for big/rare sizes, a rolling window for common sizes.
- None of this predicts price ahead of time — use it to confirm what's already happening, not to front-run a move that hasn't started.
- Watch for disagreement between size groups — small selling while big buys (or the reverse) reads price more cleanly than either group alone. Still won't tell you what happens next.