When small traders sell and big traders buy, price goes up
NQ 1-min · 2022-01-03 → 2026-04-16 · 1,100 sessions · tick-derived · session opens 07:30 CT
Three indicators, two independent conditions
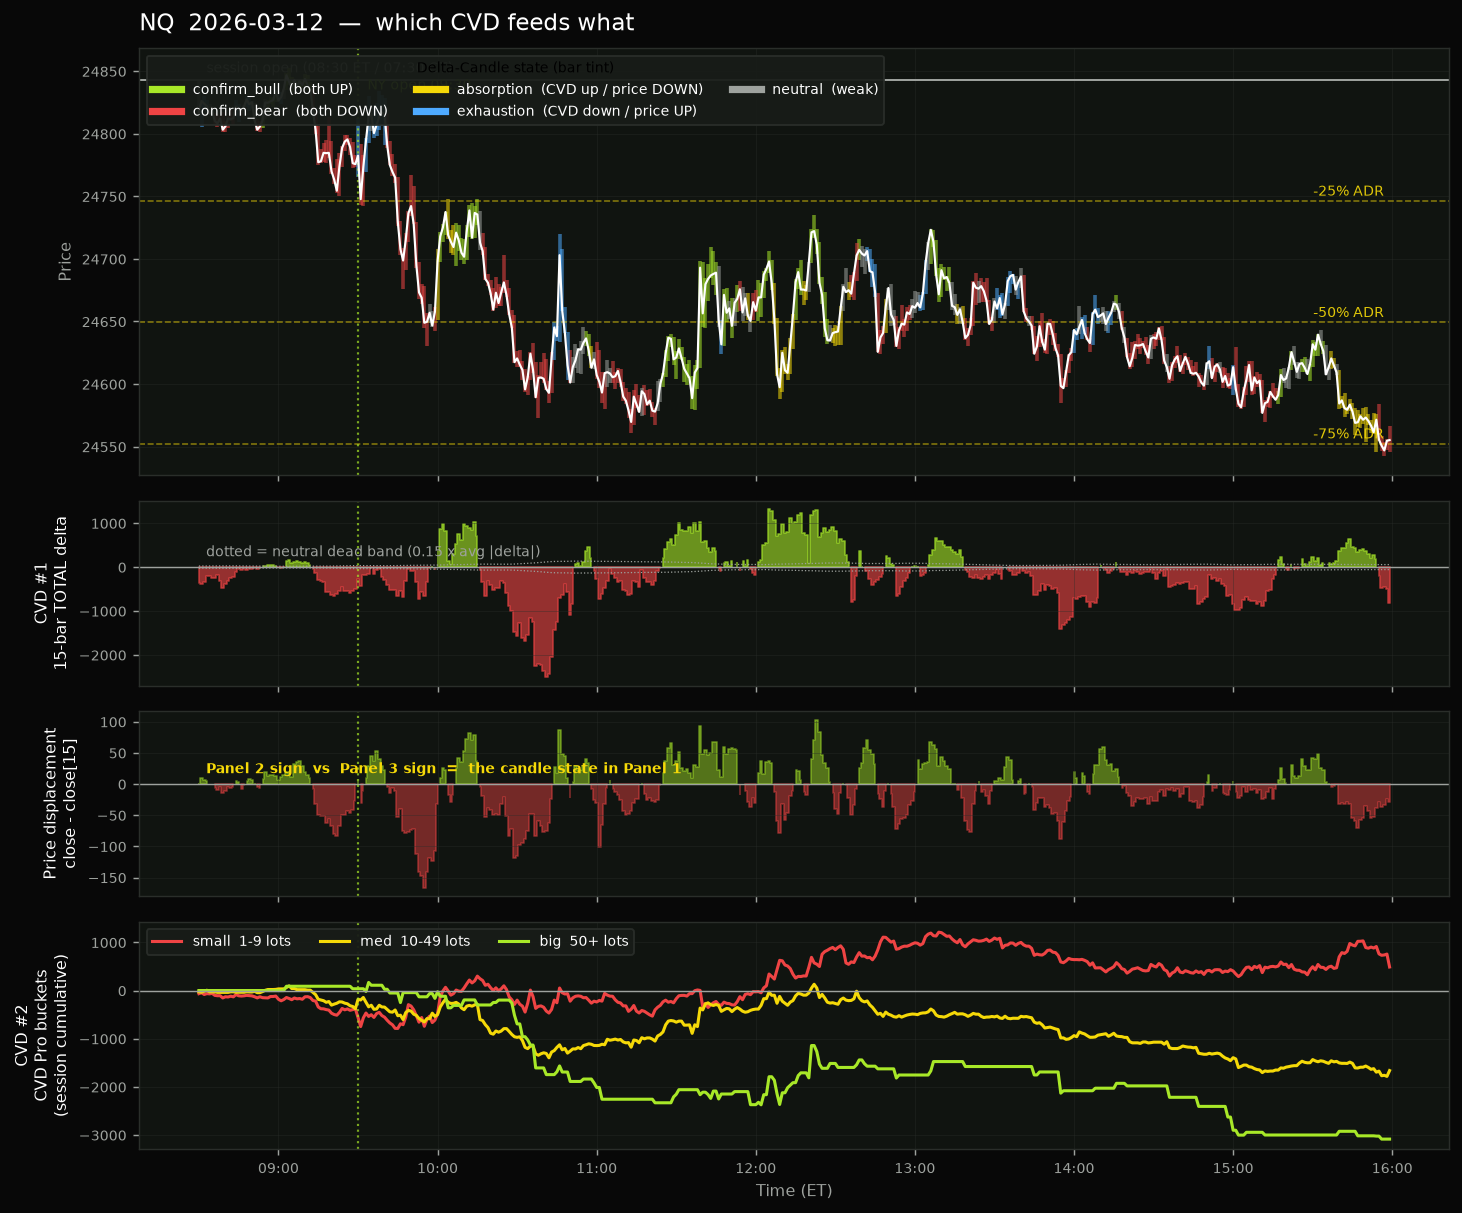
- Multi-period alignment. At 15, 30 and 60 bars, rolling total-delta CVD and session-anchored price displacement both lean bullish.
- Little-vs-big divergence. Session-cumulative 1-lot CVD is selling while 10+ is buying, confirmed by the 2+ bucket.
- Strength gate. InertiaTick glow tier ≥ 1. Long only, 09:30–15:30 ET, 100pt target / 75pt stop.
Sharpe 1.45, profitable every year
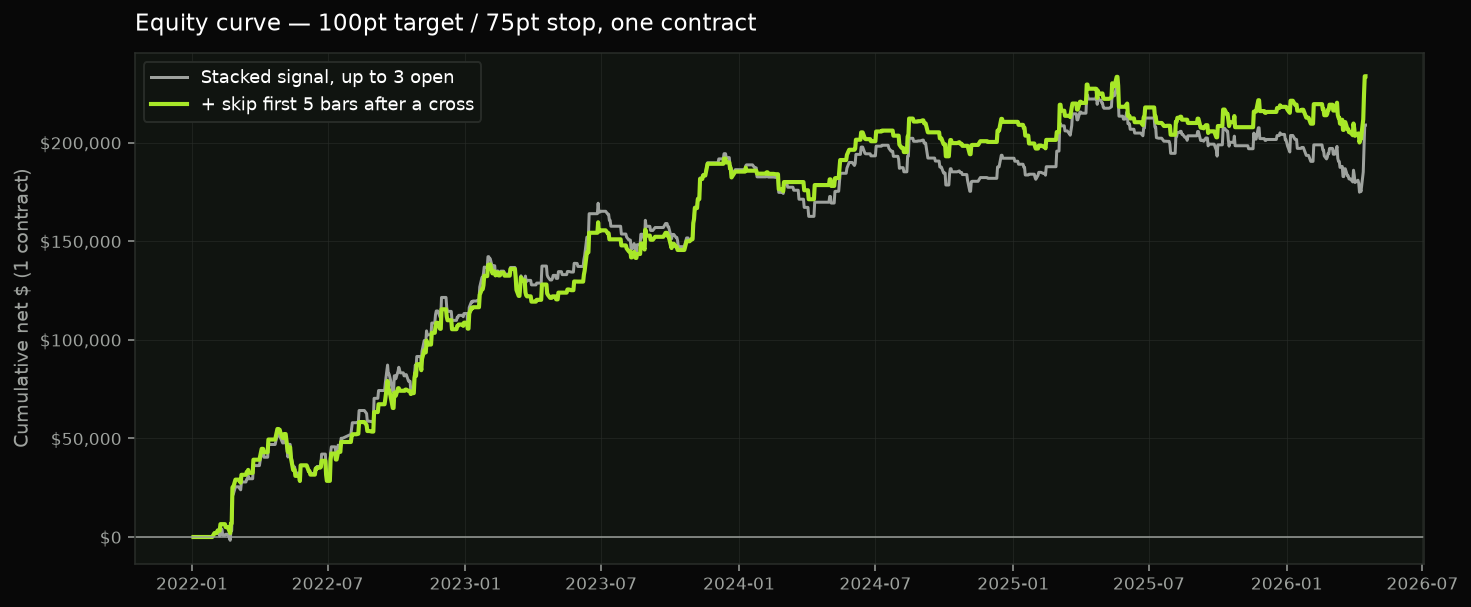
Never trade the fresh cross
Waiting a handful of bars after session CVD crosses zero is the single highest-value rule in the study. Entering in the first five bars loses money; everything after it is profitable.
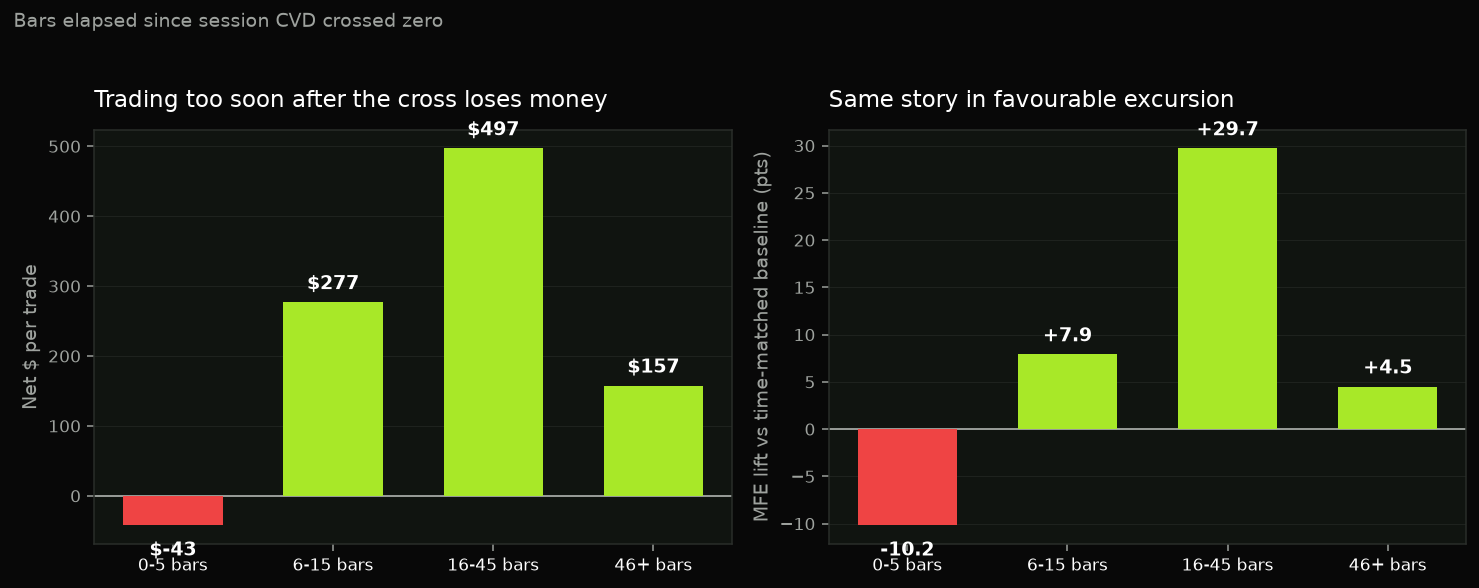
| Bars since CVD crossed zero | Signals | MFE lift | $/trade | Win |
|---|---|---|---|---|
| 0-5 bars (fresh cross) | 186 | -10.2 | $-43 | 45.0% |
| 6-15 bars | 214 | +7.9 | $277 | 54.3% |
| 16-45 bars | 248 | +29.7 | $497 | 62.7% |
| 46+ bars (settled) | 1,182 | +4.5 | $157 | 52.6% |
Three things that did not work
Bigger CVD pushes are not better signals
Quintiles of CVD strength against its own recent average. If magnitude mattered this would climb. The strongest quintile has the worst lift and the highest adverse excursion — closer to climax than confirmation.
| CVD strength | Signals | MFE lift | Avg MAE |
|---|---|---|---|
| Q1 (weakest) | 366 | -3.4 | 81.7 |
| Q2 (mid) | 366 | +15.8 | 76.5 |
| Q3 (mid) | 366 | +18.3 | 76.8 |
| Q4 (mid) | 366 | +4.1 | 72.6 |
| Q5 (strongest) | 366 | -0.5 | 87.9 |
Restricting to the first 3 hours of RTH
Roughly halves per-trade expectancy and destroys significance on the independent read — p = 0.314 versus p = 0.010 for the full window.
Scalping it
A 35pt target barely clears costs. Expectancy climbs steadily with target width: 35pt ≈ $20, 100pt = $165, 200pt = $196 per trade. This is a slow directional drift, not a scalp — and tight stops turn it negative outright.
What it looks like on a chart
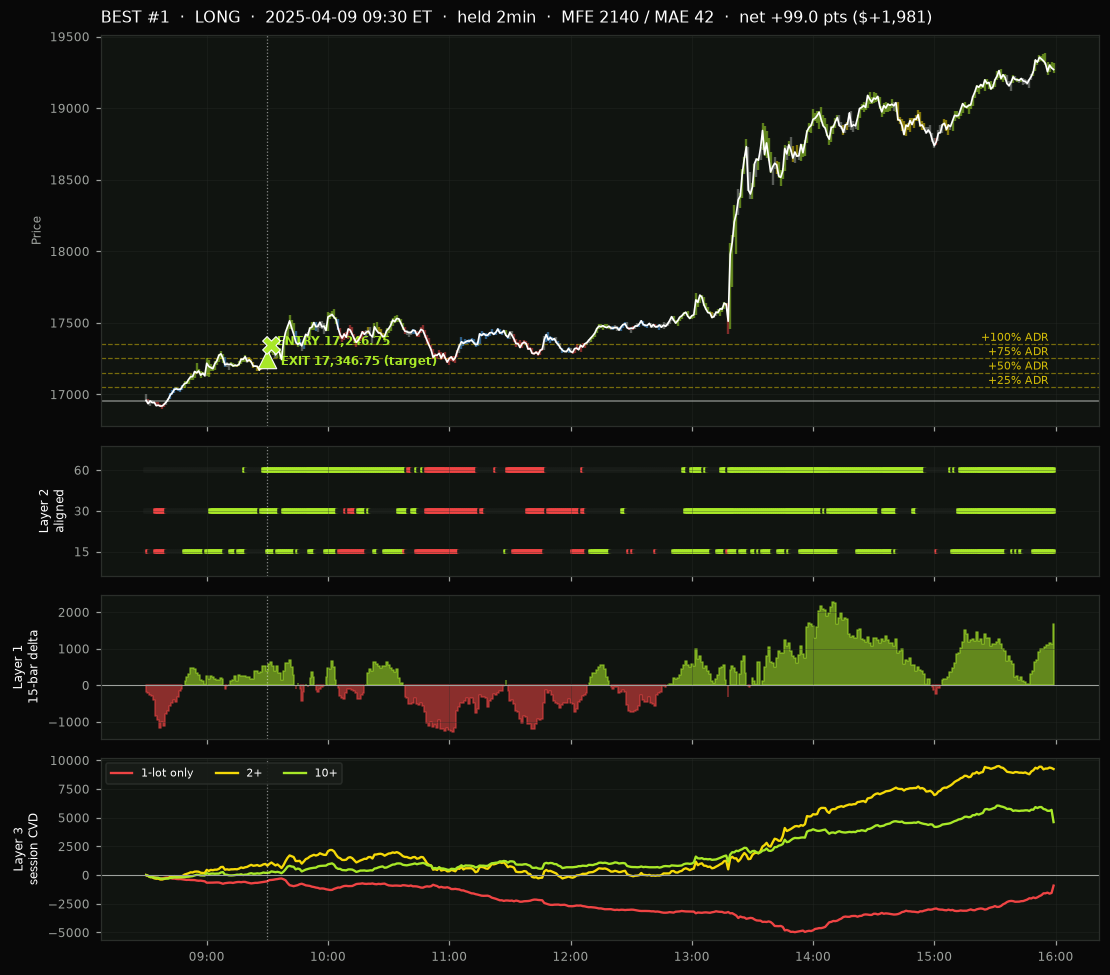
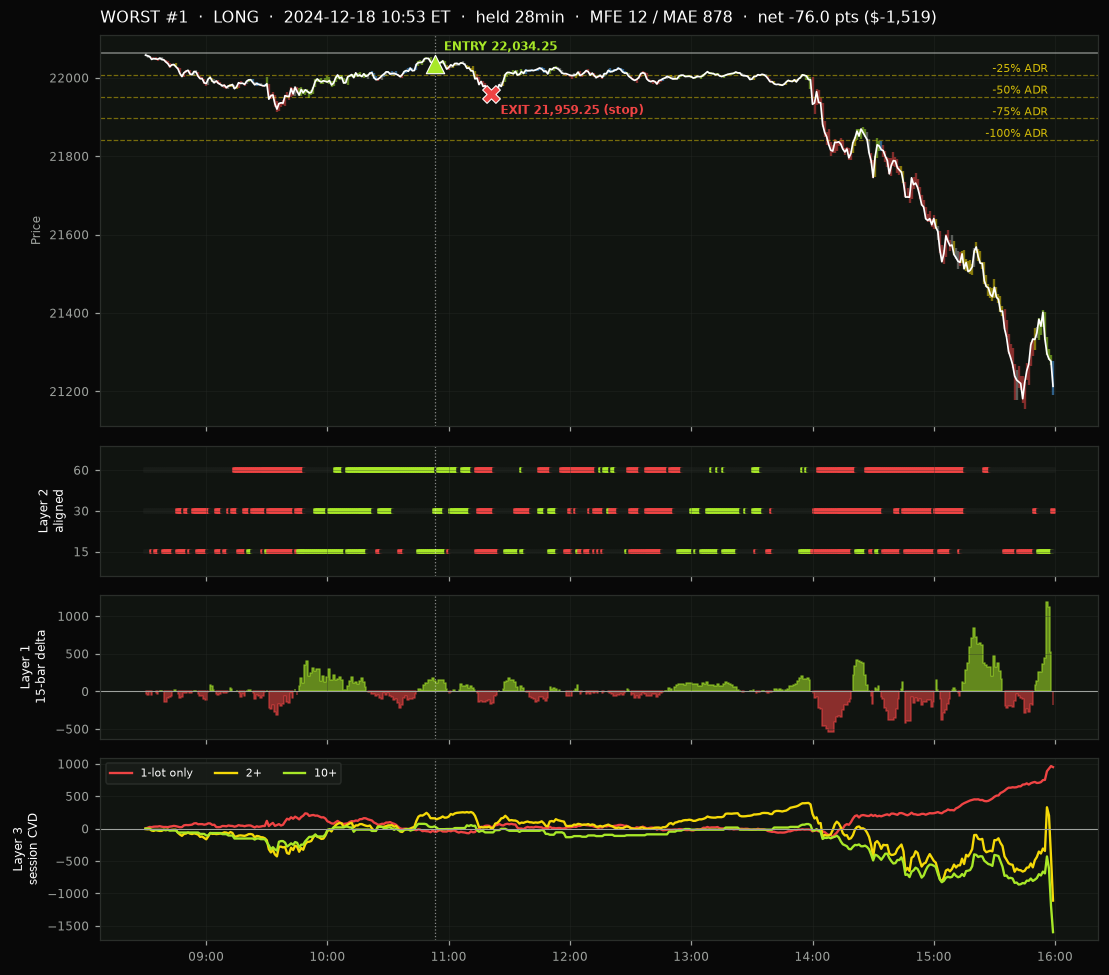
Caveats
- It fires ~1.0×/day after the freshness filter. Long flat stretches are normal; boredom-trading is the practical risk.
- Concurrent positions need margin. Uncapped, this peaked at 14 open at once. The cap-3 numbers assume 3 contracts available.
- Several bucket boundaries were tested when finding the timing rule, so the most extreme cells carry selection risk. The ≥6 bar rule is the one that survives on a full sample.
- Costs are 1-contract: 2 ticks slippage + $9 commission = 0.95 pts per trade. Breakeven slippage is 9.2 pts, so the result is not resting on that assumption.
- Overnight is untested. Everything here is the 08:30–16:00 ET session.