PND Rolling Bucket CVD
Cumulative delta split by the size of the order behind it. Four configurable buckets, each accumulating its own CVD over a rolling window or the session — so you can see the one-lot crowd and the size players as separate lines instead of one number that averages them together.
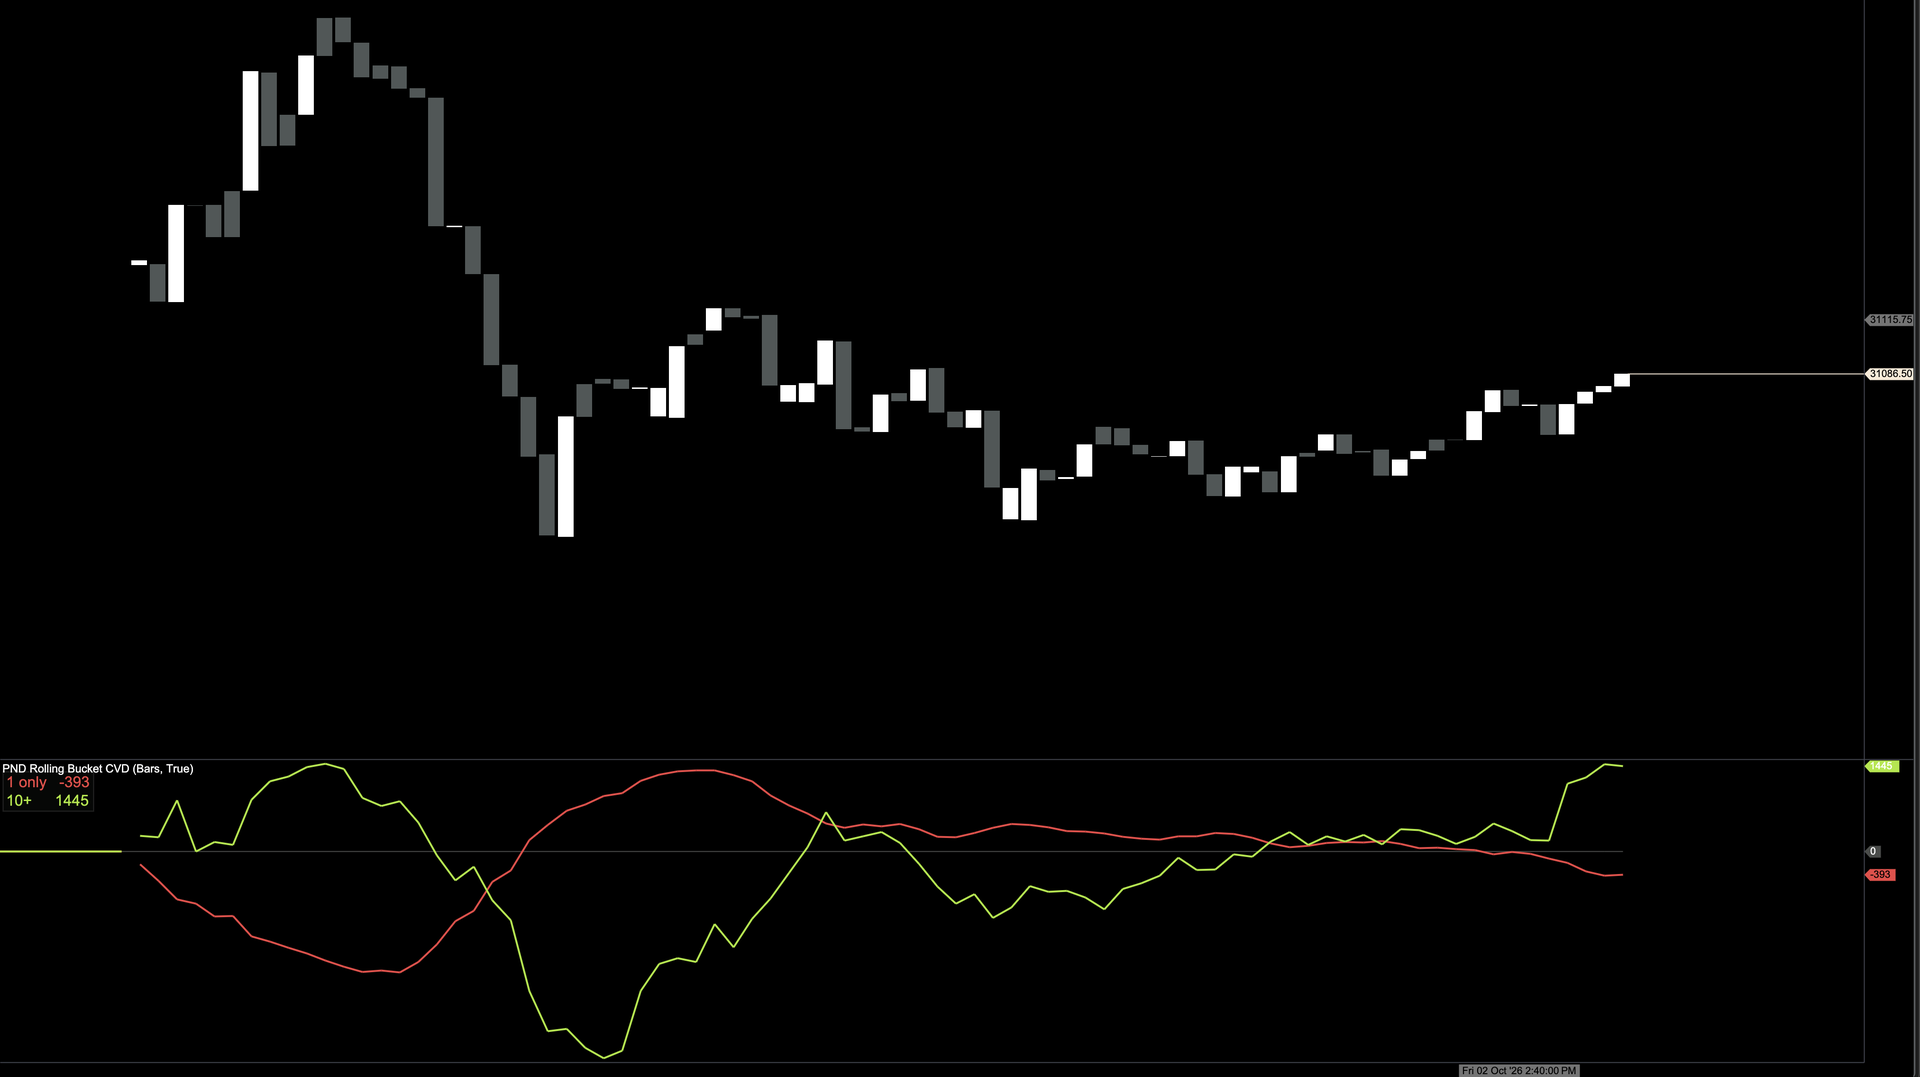
Two buckets on NQ. The legend top-left is the readout — 1 only −393, 10+ 1445. They cross repeatedly through the middle of the session and finish on opposite sides of zero: the one-lot crowd net sellers, size net buyers. A single CVD line would have shown you one number somewhere between the two.
One CVD line hides who is doing the trading
Ordinary cumulative delta adds up every aggressive buy and subtracts every aggressive sell. A thousand one-lot orders and a single thousand-lot order move it by exactly the same amount. But they are not the same event, and they rarely mean the same thing.
This indicator runs that same calculation several times in parallel, each time counting only the orders inside a size range you define. The result is one line per bucket, so a session where retail sold into institutional buying looks completely different from one where everybody sold together — even though a single CVD line would show you a similar number in both cases.
Four size filters, and they may overlap on purpose
Each bucket has a min lots and a max lots, where a max of 0 means no upper limit. An order counts toward a bucket when its size falls inside that range. Buckets are evaluated independently, so the same order can land in more than one — and the default set relies on that.
The default set. 10+ is deliberately a subset of 2+: 2+ answers “is anything other than single lots happening?” while 10+ answers “is real size happening?” Comparing a bucket against a superset of itself is the whole point, not a double-count.
min 1, max 1 — exactly single-lot orders. On NQ these are roughly three-quarters of all orders but under half the volume, so they dominate the count and not the money.min 2, max 0 — everything that is not a single lot. Useful as a confirmation line: if 2+ and 10+ disagree, the mid-sized orders are doing something different from the big ones.min 10, max 0 — size with intent. On NQ the 99th percentile order is about 10 lots, so this bucket is genuinely the tail rather than an arbitrary round number.50+ line on NQ, or a much lower threshold on a thinner contract where 10 lots is already enormous.Why “Cumulative Trades” has to stay on
A large order rarely reaches the tape as one print. It is filled against whatever resting liquidity is there, so it arrives as a burst of smaller prints sharing a timestamp. If you size those fragments as they arrive, a 60-lot sweep is recorded as a dozen unrelated small orders — and it never reaches the 10+ bucket at all.
The same 60 lots, read two ways. Note what happens to 10+: read raw it sees nothing at all, because no single fragment was big enough to qualify. With Cumulative Trades ON (the default) ATAS merges them first and the order is sized as the sweep it actually was. 2+ barely moves — it is the buckets at the edges that are destroyed.
This is not a cosmetic preference. Testing this against the NQ tape, turning the setting off inverted which bucket looked dominant — the large-order line went quiet and the small-order line absorbed its volume. That is why it is exposed as a visible option rather than hidden: if your numbers ever look strange, this is the first thing to check.
Rolling window, or cumulative session
By default the session resets on your chart's own session boundary. Turn on use custom session reset time to reset at a time you choose instead — 08:30 exchange time is the usual choice on NQ, because it starts the count at the pre-market economic releases rather than at the cash open. The time is entered in exchange time, not your local clock.
Each bucket says its own number
Every enabled bucket prints its name and current value on the panel — names on the left, values right-aligned in their own column, so the whole thing scans vertically instead of as ragged runs of text. Each bucket has its own label text colour, set separately from its line colour: on a busy chart the colour that makes a line readable is often not the one that makes small text readable against the same background.
The legend sits below the platform's own indicator caption by default. That clearance is a setting rather than a fixed number, because the caption's height moves with your platform font — if they ever touch, raise Legend clearance from top. You can also move it to any corner, change its text size, and switch off the dark backing panel.
Separately, the platform prints each bucket's current value in a marker on the right-hand axis, and that marker's background is the bucket's line colour. The value text defaults to white, which is unreadable on a bright lime or yellow bucket — so every bucket has its own Axis text color, set here to black by default rather than the platform's white. You can also switch the axis markers off altogether.
When the small and big buckets disagree
Pick one bucket as small and one as big. Any bar where the two have opposite signs gets a marker — a dot, arrow, cross or block, placed on the big bucket's line so it reads against the series it describes. Optionally it can raise an ATAS alert, which fires once when a divergence begins rather than on every bar it persists.
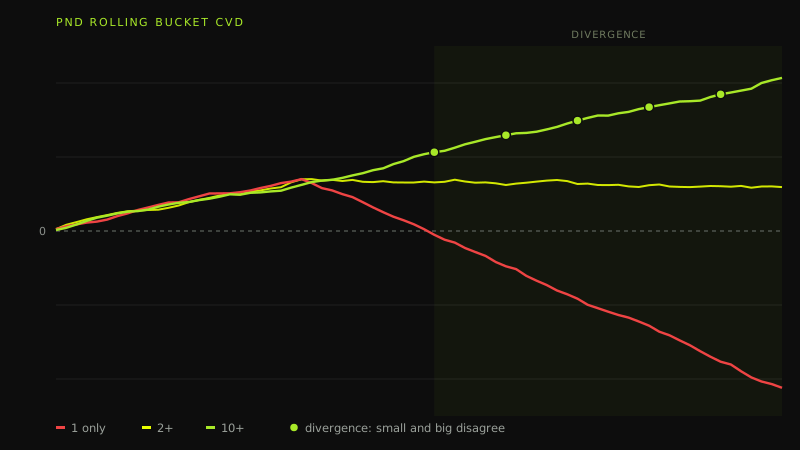
The shape to recognise. Everyone agrees into the middle of the session; then the small line rolls over while the big one keeps going. The shaded stretch is the divergence, and those bars carry the marker.
Divergence needs two different buckets, both enabled. If you point small and big at the same bucket, or at one that is switched off, it can never fire — and the panel will tell you so rather than silently showing nothing.
Two studies and a walkthrough
This indicator is not a hunch rendered as lines. Both of the claims the page makes — that the default buckets are the ones worth watching, and that divergence resolves the opposite way to the obvious reading — come from studies you can read in full.
Four things worth recognising
10+ through an impulsive move is worth noticing, because it means the move is not being funded by size.What it needs, and how far back it sees
Nothing but your own broker feed in ATAS. There is no account, no API key and no PND server in the path — the indicator asks ATAS for the current session's cumulative trades, then accumulates live from there. Attaching mid-session still gives you the whole day so far.
History depth is whatever your feed serves for the current session, which on most futures feeds is the full session from its open. It does not load prior days: an order flow panel is a read on today's participants, and stitching a month of history behind it would imply a continuity that the underlying data does not have.
If a feed will not serve session history at all, the panel says so in plain language rather than drawing an empty chart — an empty panel and a quiet market look identical, and that is exactly the failure that should never be silent.
Every setting
0 means no upper cap.Three steps
PNDRollingBucketCVD.dll — this build targets ATAS X. Open ATAS → Help → About to check; if the title says ATAS X you are in the right place.PNDRollingBucketCVD.dll in the indicators folder:Windows: %AppData%\ATAS\Indicators\macOS: ~/Library/Application Support/ATAS/Indicators/PND Rolling Bucket CVD from the indicators panel (the file isPNDRollingBucketCVD.dll; the indicator inside it is listed under ProfitNotionDaily). It opens in its own sub-panel. .NET caches assemblies until the app closes, so a full quit is required — not just closing the chart.What this is not
This indicator reports what has already traded. It does not predict price, it does not generate entries, and no configuration of it constitutes a strategy. The divergence marker in particular is a context flag — and as the note above explains, it resolved opposite to the intuitive reading in our own testing.
Free to use, not to resell. Trading futures carries substantial risk of loss. Nothing here is financial advice.