PND GexBot
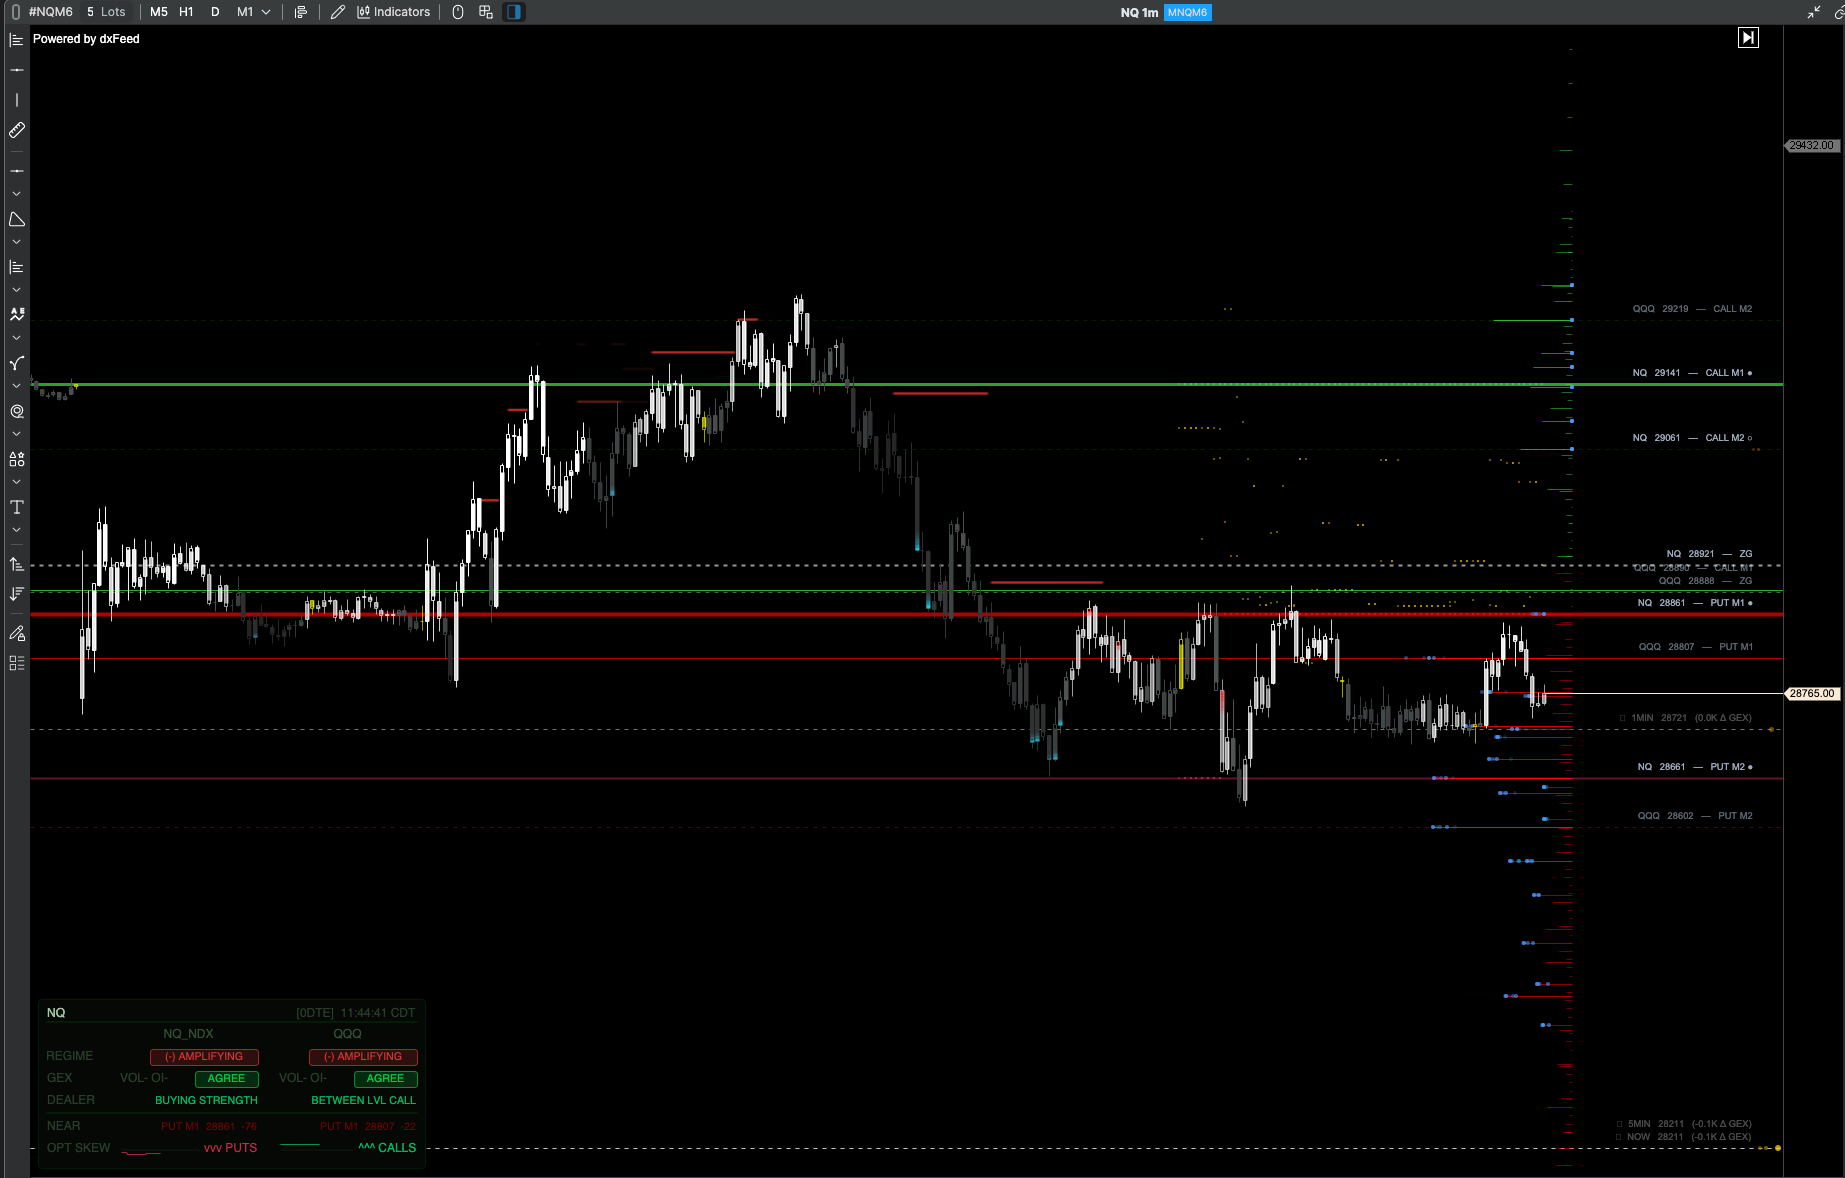
Live Gamma Exposure levels from GEXBot overlaid on NQ, ES, GC — and any other chart in ATAS/X. Zero GEX, call walls, put walls, confluence zones, and the new State Block with an in-memory OPT SKEW sentiment sparkline. Updated every 30 seconds.
What it does 📊
The four indicators
Confluence tolerance: 50 NQ points. When an NQ_NDX level and a QQQ level (converted to NQ price space) land within 50 pts of each other, the zone is highlighted — these tend to be the stickiest levels.
Confluence tolerance: 10 ES points. ES is a tighter instrument — levels that agree across SPX and SPY within 10 pts are high-confidence zones.
Confluence tolerance: 5 GC points. See the GLD → GC conversion section below.
Single-source only. For the dual-source NQ and ES views with confluence zones, use the dedicated NQ or ES indicators above.
Single Instrument — symbol mapping
| Chart instrument | GEXBot source | Ratio mode |
|---|---|---|
| NQ / MNQ | NQ_NDX | No |
| ES / MES | ES_SPX | No |
| GC / MGC | GLD | Yes — GC / GLD ratio |
| SI / MSI | SLV | Yes — SI / SLV ratio |
| YM / MYM | YM | No |
| RTY / M2K | RTY | No |
| QQQ, SPY, VIX, AAPL, … | Direct (same symbol) | No |
Setup — first time
ATAS Indicators folder
in ATAS indicator list
in indicator settings
shows data timestamp
per source independently
Level lines — what each line means
| Line | What it marks |
|---|---|
| Zero GEX | The gamma flip point. Above it, dealers are long gamma — they buy dips and sell rips, suppressing volatility (range-bound behavior). Below it, dealers are short gamma — they chase moves, amplifying volatility (trending behavior). |
| Call Wall 1 | Strongest positive GEX strike above Zero GEX. Heavy call open interest creates dealer short-gamma concentration here — tends to act as resistance or magnet depending on GEX regime. |
| Call Wall 2 | The second-largest call GEX concentration above Zero GEX. Useful for setting targets or identifying where a rally may slow. |
| Put Wall 1 | Strongest negative GEX strike below Zero GEX. Heavy put concentration — acts as a support floor in positive GEX regime, or accelerant in negative GEX regime. |
| Put Wall 2 | The second-largest put GEX concentration below Zero GEX. Watch for bounces or breakdown acceleration near this level. |
Confluence zones
When a level from Source A (index) and a level from Source B (ETF) land within the confluence tolerance of each other, a shaded band is drawn between them. These zones represent agreement between two independent options markets and tend to offer stronger support/resistance than either level alone. The tolerance is instrument-specific: 50 pts for NQ, 10 pts for ES, 5 pts for GC.
State Block — the on-chart overlay
A compact corner overlay (configurable) showing regime, dealer positioning, the nearest key level, and a live OPT SKEW sparkline. NQ and ES render two source columns side by side (Index + ETF); GC and the Single Instrument indicator render a single column.
| Row | What it means |
|---|---|
| REGIME | Weighted combination of Vol GEX and OI GEX (65 % / 35 %) collapsed into a single regime read with a sign prefix you can scan at a glance. (+) DAMPENING — dealers net long gamma; hedging suppresses moves, expect range-bound behavior. (~) NEUTRAL — signals mixed or near-zero; regime transitioning, treat levels as less reliable. (−) AMPLIFYING — dealers net short gamma; hedging accelerates moves, expect trending and elevated volatility. |
| GEX | Raw Vol GEX and OI GEX signs side-by-side, with an AGREE / DISAGREE pill. Disagreement signals a transitional regime where positioning is mixed and the directional read is less reliable. |
| DEALER | Plain-language dealer-positioning read. Three states: AT [level] — price within the proximity range of a key level (high-tension zone). NEAR / BUYING STRENGTH / BETWEEN LVL CALL — descriptive state based on which side of the structure price is on. BETWEEN LEVELS — price is genuinely in open space (uses a separate, wider threshold so it only triggers when price is clearly outside the proximity band of every wall). |
| NEAR | The single nearest key level with a signed distance. Example: PUT M1 28,861 −76 means Put Wall 1 sits at 28,861 and price is 76 points below it. The sign tells you which side of the level you're on without having to read the chart. |
| OPT SKEW | A mini sparkline of the Delta Risk Reversal (DRR) across the current ATAS session, with a directional label on the right — ^^^ CALLS (calls dominant, bullish skew) or vvv PUTS (puts dominant, bearish skew). Calls-dominant periods push the trail up; puts-dominant push it down. See How the OPT SKEW trail works below. |
| [09:47:22] | Local time of the last successful data fetch. If this timestamp stops updating, the API connection has stalled — check your API key and internet connection. |
How the OPT SKEW trail works
The sparkline is purely in-memory — no file is written to disk. History accumulates from the moment the indicator loads and is lost when ATAS restarts or the indicator is removed from the chart. On every poll cycle, regardless of whether the GEXBot data has changed, a DRR reading is stamped into the trail — so the sparkline keeps populating even during stable conditions or after hours (flat line when stable, oscillating when sentiment shifts). A dim centerline baseline is always visible; the oscillating line appears within ~60 seconds of the first successful poll.
GC & SI — ETF to futures ratio conversion
GEXBot does not publish GC or SI futures tickers. Instead, GLD (SPDR Gold Shares ETF) and SLV (iShares Silver Trust) are used as proxies, and every level is converted into futures price space using a live ratio:
futures level = ETF level × ratio
Why this works: GLD tracks ~0.0919 troy oz of gold per share (slightly less than the original 0.10 oz due to annual expense-ratio accrual); SLV is similar for silver. The ratio automatically accounts for this drift and for the futures basis (contango or backwardation vs. spot) — because the futures chart price already reflects the current front-month basis. This is the same methodology used by professional TradingView gold and silver converters.
Important: The ratio is recalculated on every rendered frame using the most recent bar close — not just on API polls. This keeps levels pinned to their correct price even as the futures contract ticks intraday.
All settings — quick reference
| Setting | Default | What it controls |
|---|---|---|
| 1. Connection | ||
| API Key | — | Your GEXBot custom API key. Required — the indicator shows "Enter API Key" until this is populated. Get yours at gexbot.com. |
| Refresh Interval (secs) | 30 | How often the indicator polls GEXBot for updated levels. Minimum 10 s, maximum 300 s. GEX levels typically update every few minutes during market hours — 30 s is a good balance. |
| Expiry Period | Zero | Which options expiration window GEX data is aggregated across: Zero — 0DTE only. Options expiring today. Most reactive to intraday price movement. Best for scalping and intraday sessions. Next Expiry — The following expiration date. Broader positioning than 0DTE, less noise. Full — All expirations combined. Represents the entire options complex. Levels tend to be stickier and move less intraday — better for swing-level context. PND Combined — Polls all three periods simultaneously and draws only levels that are confirmed across two or more expiry windows. Confirmed strikes are displayed as bold lines with a ✦ prefix and a label showing which periods agreed — e.g. ✦ 0DTE+NXT Major+1 or ✦ 0DTE+NXT+FULL Zero. If a strike only appears in one period it is ignored; the chart stays clean and only high-conviction confluences are shown. The State Block displays a per-period poll status (0DTE:✓ NXT:✓ FULL:…) while data loads. |
| Max Major Levels Per Side | 2 | How many call walls and put walls to draw. 1 = only the strongest level each side. 2 = top two. Max 5. More levels = more lines on the chart; start with 2 to keep it readable. |
| Documentation | read-only | Displays the URL for this reference page directly in the indicator settings panel — profitnotiondaily.com/indicators/pnd-gexbot |
| 2. Source A (index) — NQ_NDX / ES_SPX / GLD / auto | ||
| Enabled | true | Toggle the index source lines on/off without disconnecting the data feed. Useful for temporarily hiding one layer. |
| Zero Line Color | varies | Color of the Zero GEX line for Source A. Default is a semi-transparent white for all instruments. |
| Call Wall 1–3 Color | greens | Colors for the first, second, and third call wall lines. Call Wall 1 is the strongest. Default palette uses progressively darker greens. |
| Put Wall 1–3 Color | reds | Colors for put wall lines. Put Wall 1 is the strongest. Default palette uses progressively darker reds. |
| 3. Source B (ETF) — QQQ / SPY [NQ & ES only] | ||
| Enabled | true | Toggle the ETF source lines on/off. The GC and Single Instrument indicators have no Source B — this group is hidden. |
| Zero / Call / Put Colors | varies | Same structure as Source A but for the ETF layer. Source B lines use slightly different alpha values to visually distinguish them from the index layer at a glance. |
| 4. Display | ||
| Zero Line Width | 1 | Pixel width of the Zero GEX line. Range 1–8. The Zero line is the most important — some traders prefer 2–3 px to make it stand out from the major walls. |
| Major Level Line Width | 1 | Pixel width of call and put wall lines. Range 1–4. |
| Show Labels | true | Toggle price labels on each level line (e.g., "NQ Major+1", "QQQ Zero"). |
| Highlight Confluence Zones | true | Draw a shaded band between Source A and Source B levels that fall within the confluence tolerance. Disable to reduce visual clutter. |
| Confluence Tolerance (points) | NQ 50 / ES 10 / GC 5 | Maximum price distance between a Source A and Source B level for them to count as a confluence zone. Pre-set by instrument — adjust if you want tighter or looser zones. |
| Proximity Range | NQ 80 / ES 22 / GC 12 / Auto 15 pts | Distance from a key level at which the DEALER row switches from BETWEEN LEVELS → NEAR. Tighten this if you want NEAR to only trigger when price is genuinely tagging a wall; loosen for more frequent NEAR reads. |
| Dealer Between Levels Range | NQ 40 / ES 12 / GC 5 / Auto 8 pts | Separate, wider threshold — price must be farther than this from every key level for DEALER to show BETWEEN LEVELS. Prevents the row from flickering to BETWEEN LEVELS when price is just slightly outside the proximity band of a nearby wall. |
| Trail Alpha | 0.75 | Opacity of the OPT SKEW sparkline trail line. Range 0–1. Lower it if the trail is visually competing with price action. |
| Show Ratio Debug | false | When enabled, appends raw ratio components to the State Block header (e.g., "Chart px: 3,450.1 / GLD spot: 315.22"). Useful for verifying the GC or SI conversion is correct. |
| State Block Position | TopRight | Corner of the chart where the State Block anchors. Options: TopLeft, TopRight, BottomLeft, BottomRight. |
| 5. Alerts | ||
| Alert on Index Zero Gamma Cross | false | Fire an ATAS alert when price crosses the Source A Zero GEX level. Useful for catching gamma flip events without watching the chart. |
| Alert on ETF Zero Gamma Cross | false | Same as above but for the Source B (ETF) Zero GEX. On NQ, this alerts on QQQ's Zero crossing projected into NQ price space. |
NQ vs ES vs GC vs Single Instrument — nuances at a glance
| Characteristic | NQ | ES | GC | Single Inst. |
|---|---|---|---|---|
| Index source | NQ_NDX | ES_SPX | GLD proxy | Auto-detected |
| ETF source | QQQ | SPY | None | None |
| Price conversion | QQQ × ratio → NQ pts | SPY × ratio → ES pts | GLD × (GC/GLD) → GC pts | Direct, or auto-ratio for GC/SI |
| Ratio updates | On each API poll | On each API poll | Every render frame | Per frame for ratio modes |
| Confluence tol. | 50 pts | 10 pts | 5 pts | N/A |
| Confluence zones | Index vs ETF | Index vs ETF | N/A | N/A |
| State Block layout | 2 columns | 2 columns | 1 column | 1 column |
| Best used on chart | NQ1! / NQ futures | ES1! / ES futures | GC1! / GC futures | Any chart |
How the data pipeline works
(NQ_NDX & QQQ)
same? skip fetch
with all levels
call & put walls
lines drawn on chart
All requests are serialized through a shared gate with a 400 ms gap between calls — preventing the GEXBot API rate limiter from triggering when multiple indicators (NQ + ES + GC + Single Instrument) are all on the same workspace and their timers fire simultaneously. A DRR reading is stamped into the OPT SKEW trail on every poll, regardless of whether levels changed — this is what keeps the sparkline populating even when GEX is stable.
Get up and running in 3 minutes
The indicator suite is distributed as a single compiled .dll file — all four indicators (NQ, ES, GC, Single Instrument) install together. A GEXBot API key is required — get yours at gexbot.com.
atas.net — download →
PNDGexBot.dll.Windows:
%AppData%\ATAS\Indicators\macOS:
~/Library/Application Support/ATAS/Indicators/PND GexBot Classic, pick NQ / ES / GC / Single Instrument, and add it to your chart.