The market is bigger
than one chart.
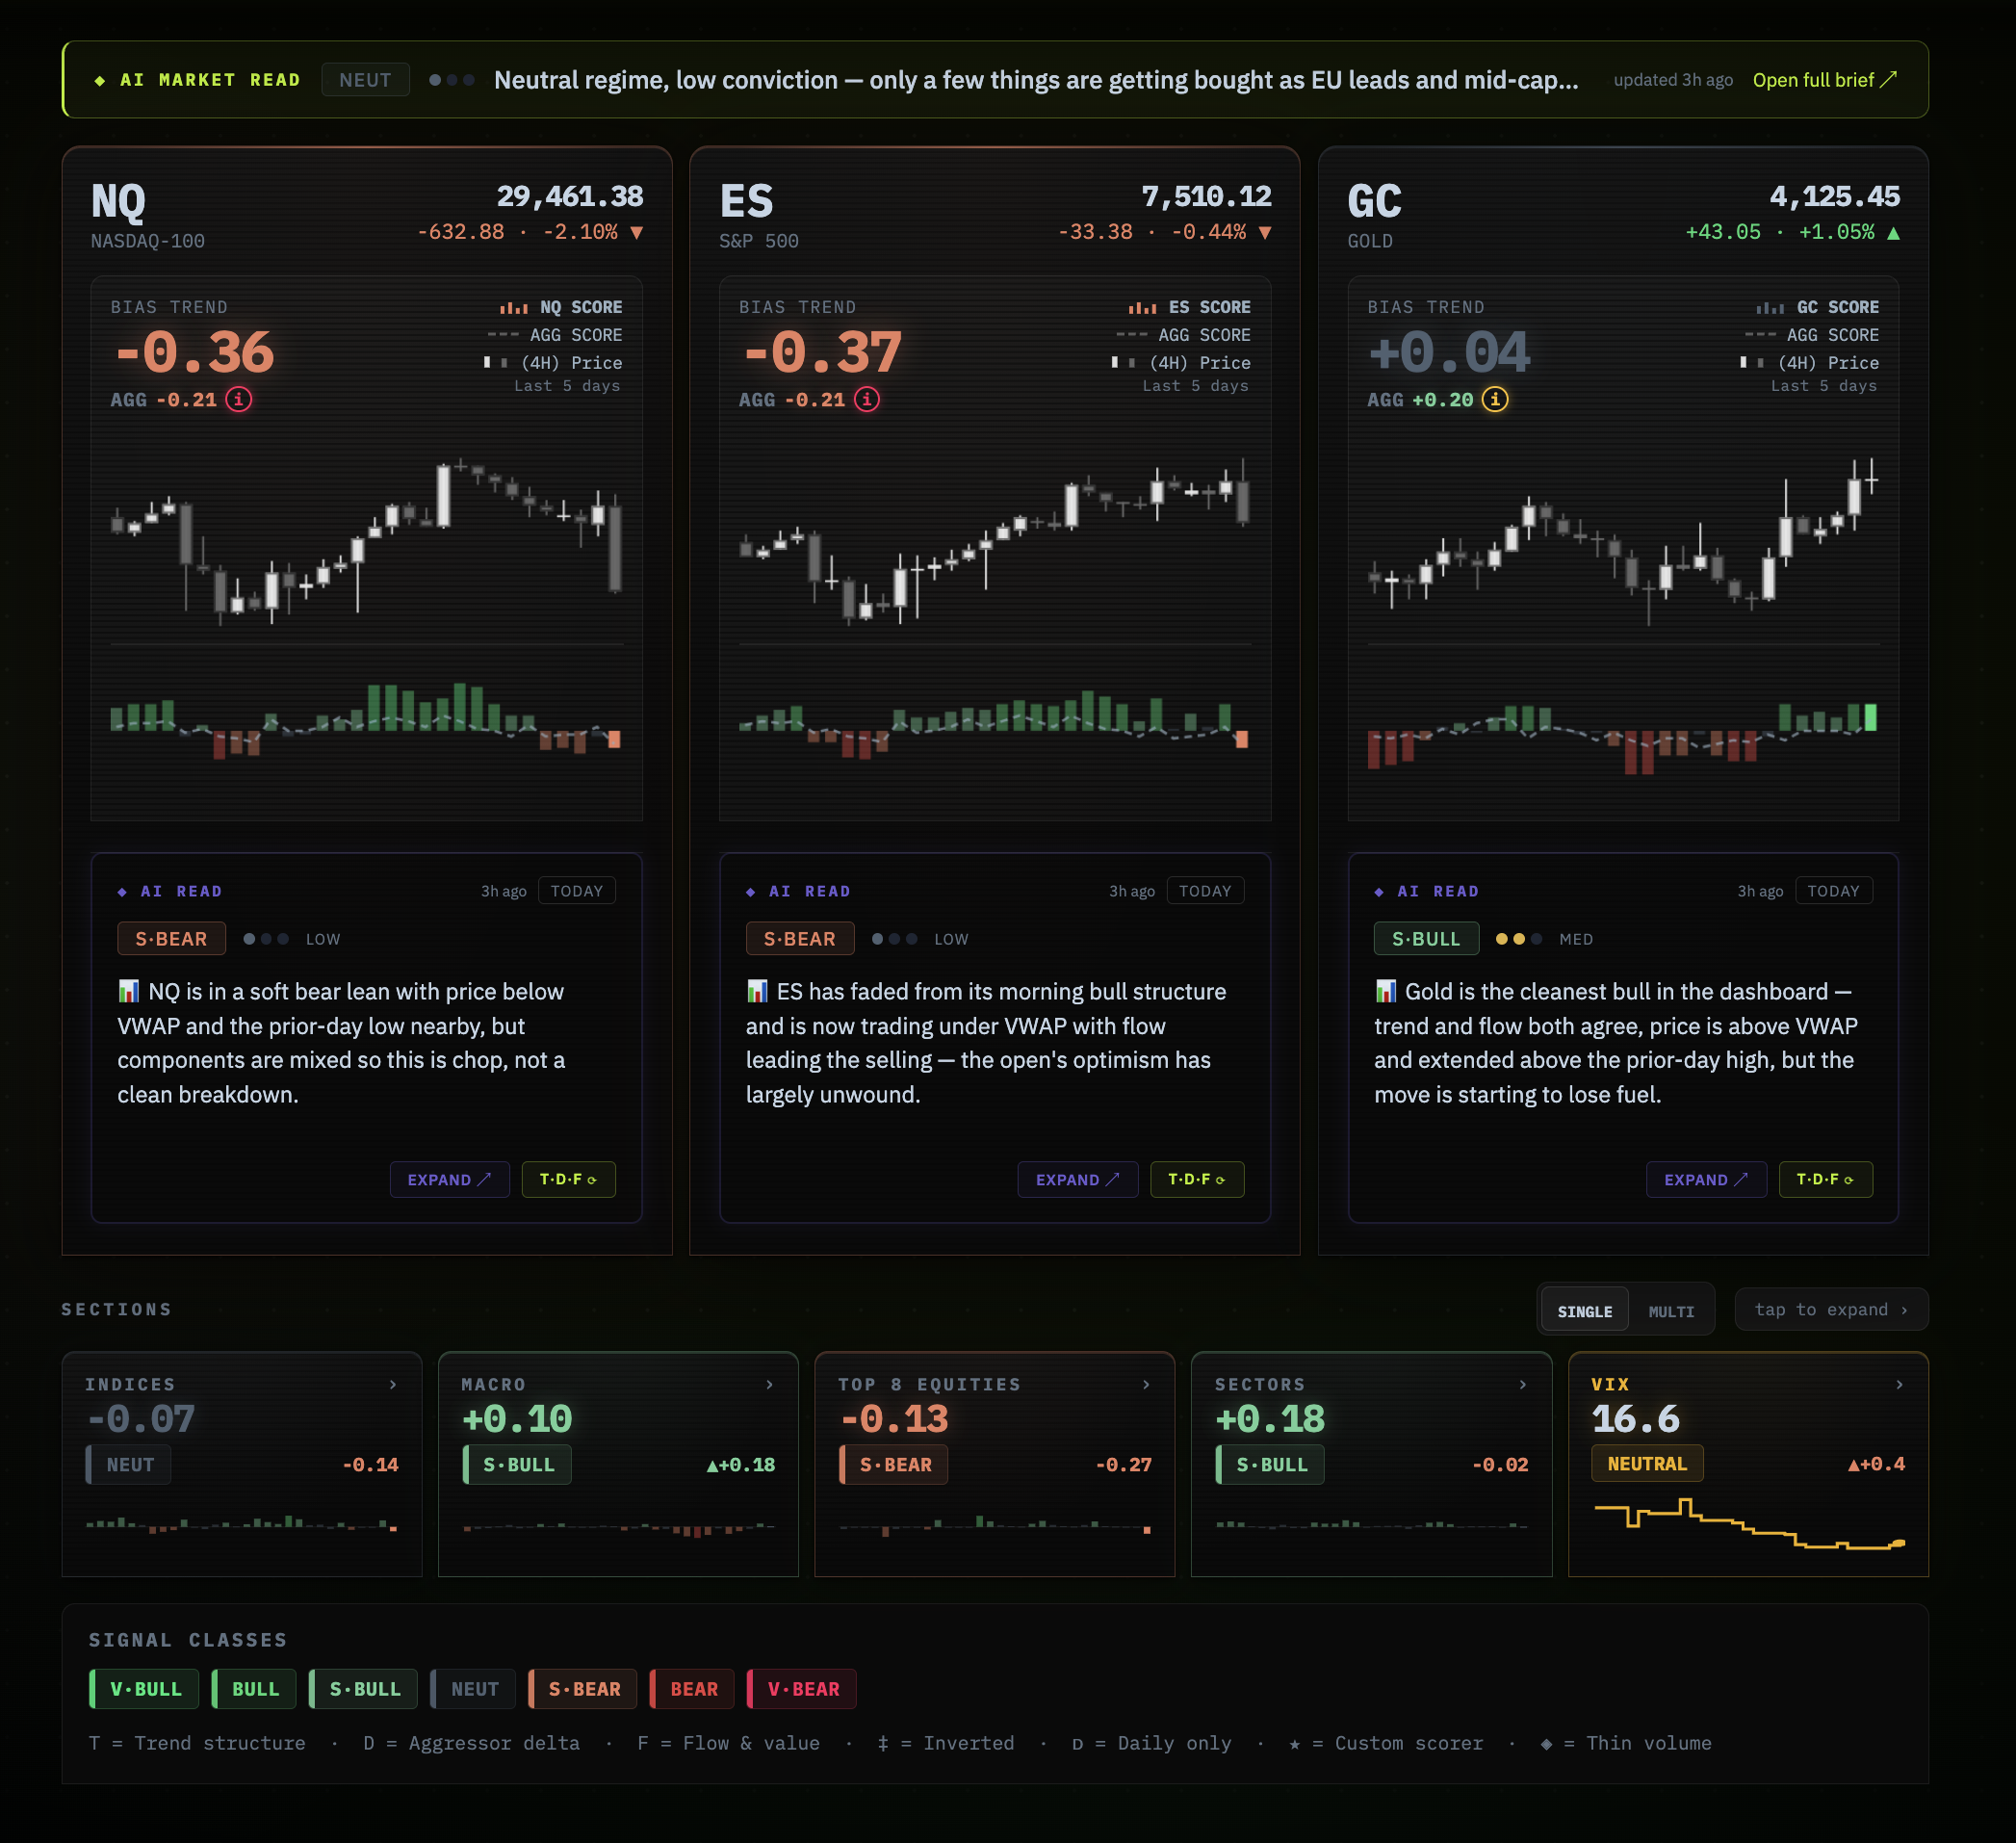
Full T·D·F scoring, AI Read, and four view modes for eight primary trading instruments — NQ, ES, GC, YM, RTY, BTC, SI, and CL — updated every 30 seconds. Backed by 30+ market breadth signals covering macro, sectors, and top equities to keep the full picture in view.
See the Matrix in action
Most traders start the day with an incomplete picture.
You're trading NQ. But NQ doesn't move in isolation. The dollar, bonds, VIX, sector rotation, and options positioning all push and pull on it — every session. Watching a single chart gives you what price is doing. It doesn't give you the full story.
USD, VIX, BTC, ZN, and sector ETFs all exert force on your primary instrument. Monitoring them individually is noise. The Matrix aggregates 32 instruments into one structured read.
Price tells you what. Delta tells you who. Flow tells you whether it's real. Without all three, you're making decisions without the full picture. Don't miss out on the complete market context.
What was GC doing when NQ reversed? Were sectors confirming or diverging? Without a structured live read, you miss the broad markets contextual backdrop.
Three independent dimensions.
One structured bias score.
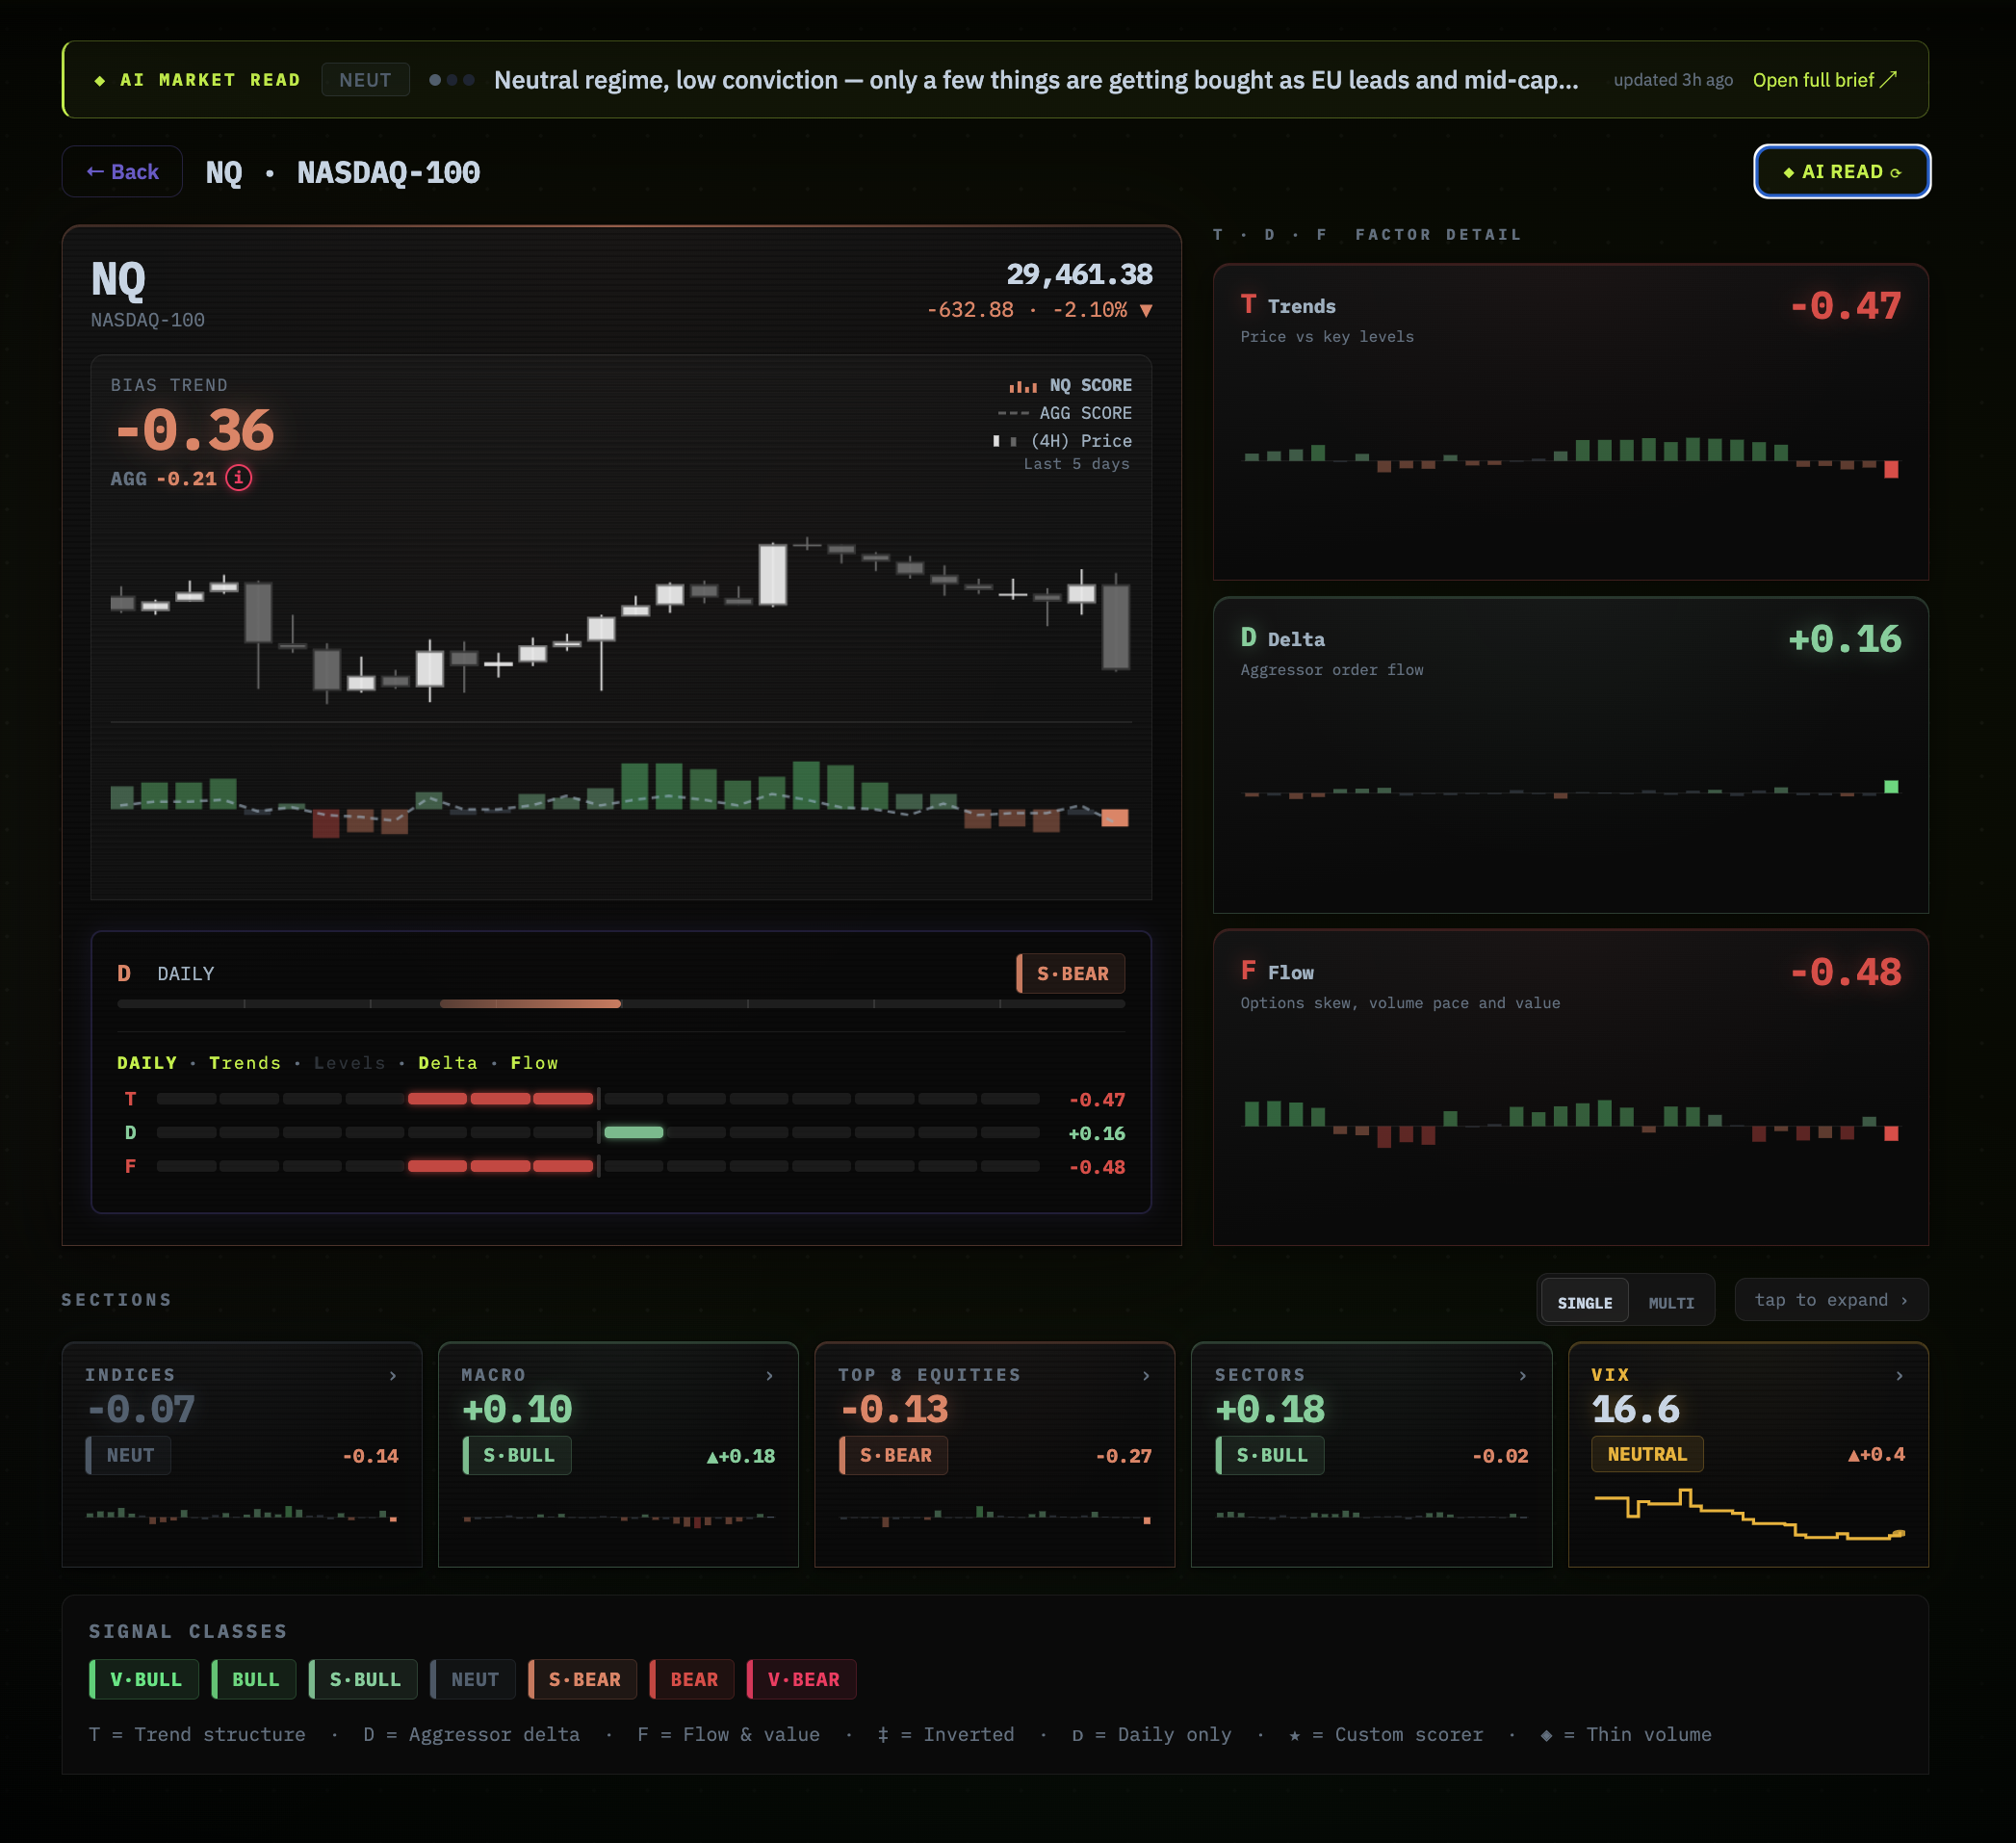
Every instrument's bias score is the weighted combination of T (Trends), D (Delta), and F (Flow) — three scoring dimensions that measure different aspects of market context. Each scores independently from −1.00 to +1.00, then blends into the aggregate.
Where is price relative to the structural map? T scores multi-timeframe alignment — EMA stacks, session opens, GEX zero-gamma, prior closes, and daily pivots. A bullish T means price is positioned above the levels that matter.
Who is in control right now — buyers hitting the offer or sellers hitting the bid? D measures net aggressor volume across multiple decay-weighted windows, so it reflects both the current session and its recent history.
Is this price move backed by real participation? F measures volume profile, VWAP structure, and options market positioning. Positive F means the move is confirmed by volume and options traders are leaning the same way.
Seven signal classes.
One number to read.
The aggregate score maps to one of seven named classes — each with a distinct color and threshold. The score gives you precision. The class gives you instant situational awareness.
Two instruments can both show BULL — but one might score +0.38 and the other +0.71. The raw score is where the precision lives.
8 hero instruments.
30+ market breadth signals.
Full T·D·F scoring, AI Read, four view modes, and real-time price for eight primary futures and crypto instruments. Backed by 30+ market breadth signals — macro, sectors, and top equities — so every read is grounded in the full market environment.
The primary instruments and their closest proxies. NQ, ES, and GC get full hero cards with expanded T·D·F breakdown and bias trend sparklines.
Dollar, bonds, volatility, crypto, and commodities. The macro backdrop that sets the risk-on / risk-off environment for the session.
The eight largest Nasdaq weightings. These names drive NQ disproportionately — a divergence in equities often leads index moves.
Sector rotation tells you which parts of the market are receiving or shedding capital. Sector divergence from index bias is often the first warning.
Every row in the matrix shows what that instrument's bias implies for NQ, ES, and GC — with inversion relationships applied automatically. A bullish USD row shows bearish FOR-NQ. Seeing all 32 instruments from your instrument's perspective, at once.
Same 32 instruments.
Different time windows.
The view mode controls the time window feeding T (Trend), D (Delta) and F (Flow). Switching views recalculates all 32 instruments globally.
Start here. The Daily Bias view is your pre-market read — it shows where the market has been leaning over multiple sessions before the open. Use it to establish whether you're looking for long setups, short setups, or staying flat. A strong Daily Bias signal is your first filter before the open.
Your active session context. Keep Day Trade running while you trade RTH. It tells you whether the current session is developing bullish or bearish character — so every entry you take is either with or against the session bias. The most-used view during market hours.
For high-frequency decisions. The 90-minute window reacts quickly to short-term aggressor shifts. Use it when you're watching the DOM and waiting for a momentum setup — is the short-term flow backing your read or working against it? Expect faster signal changes. That's the point.
The anchor for your gap analysis. Before the open, Prior Close shows where the market's bias sat at yesterday's close. Compare it to the current Daily Bias to understand how overnight activity has shifted things, and whether today is setting up with or against the prior session.
Your market read.
Already written.
The Matrix scores the market every 30 seconds. The AI Brief translates those scores into plain-language intelligence — published six times a day on the live CME session cadence. You open the dashboard and the read is already there. No parsing numbers. No figuring out what the rotation means. Just context, written for a futures trader.
The full session brief
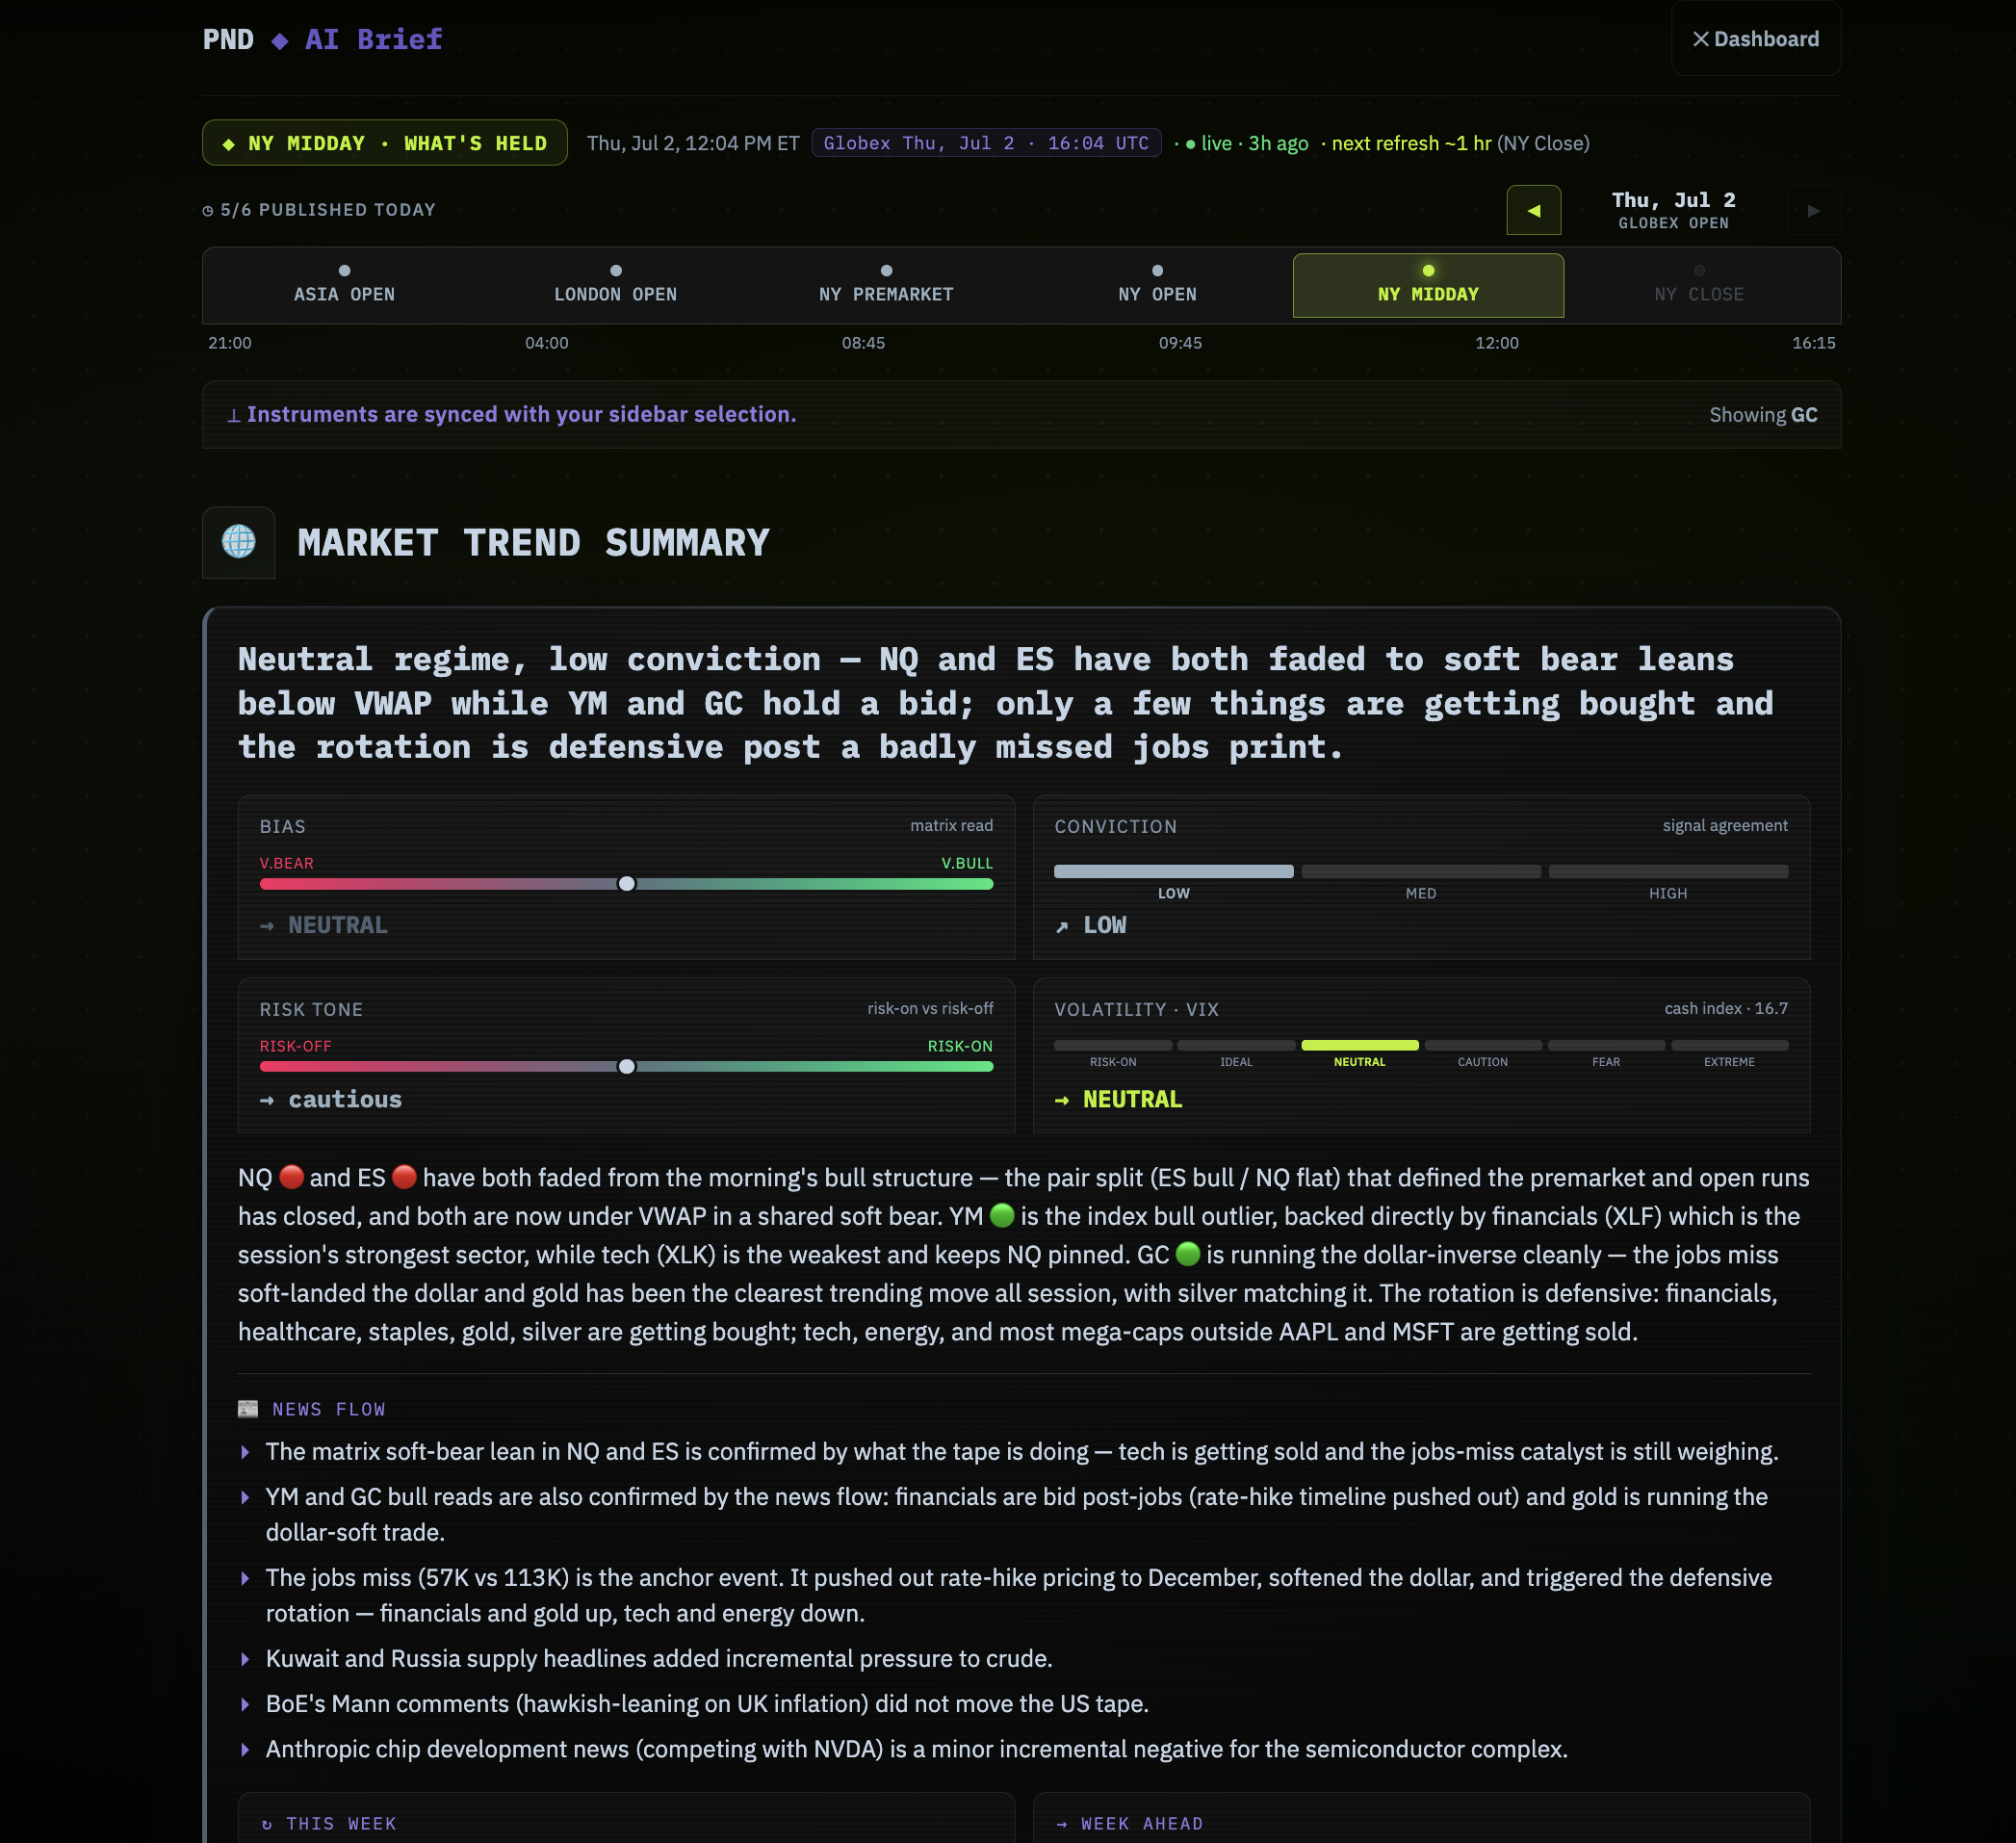
Every session publishes a complete AI-written market brief — market regime, risk tone, conviction, VIX band, rotation picture, and a per-instrument read for NQ, ES, GC, YM, RTY, BTC, SI, and CL. Economic calendar events and real news headlines (with bull/bear/neutral sentiment) are woven in. Later briefs in the day build on what earlier sessions established — so the NY Midday brief knows what Asia and London said.
Publishes at Asia Open · London Open · NY Premarket · NY Open · NY Midday · NY Close — tied to the live CME trading calendar. No briefs on weekends, holidays, or during the nightly maintenance halt.
Per-instrument — on every card
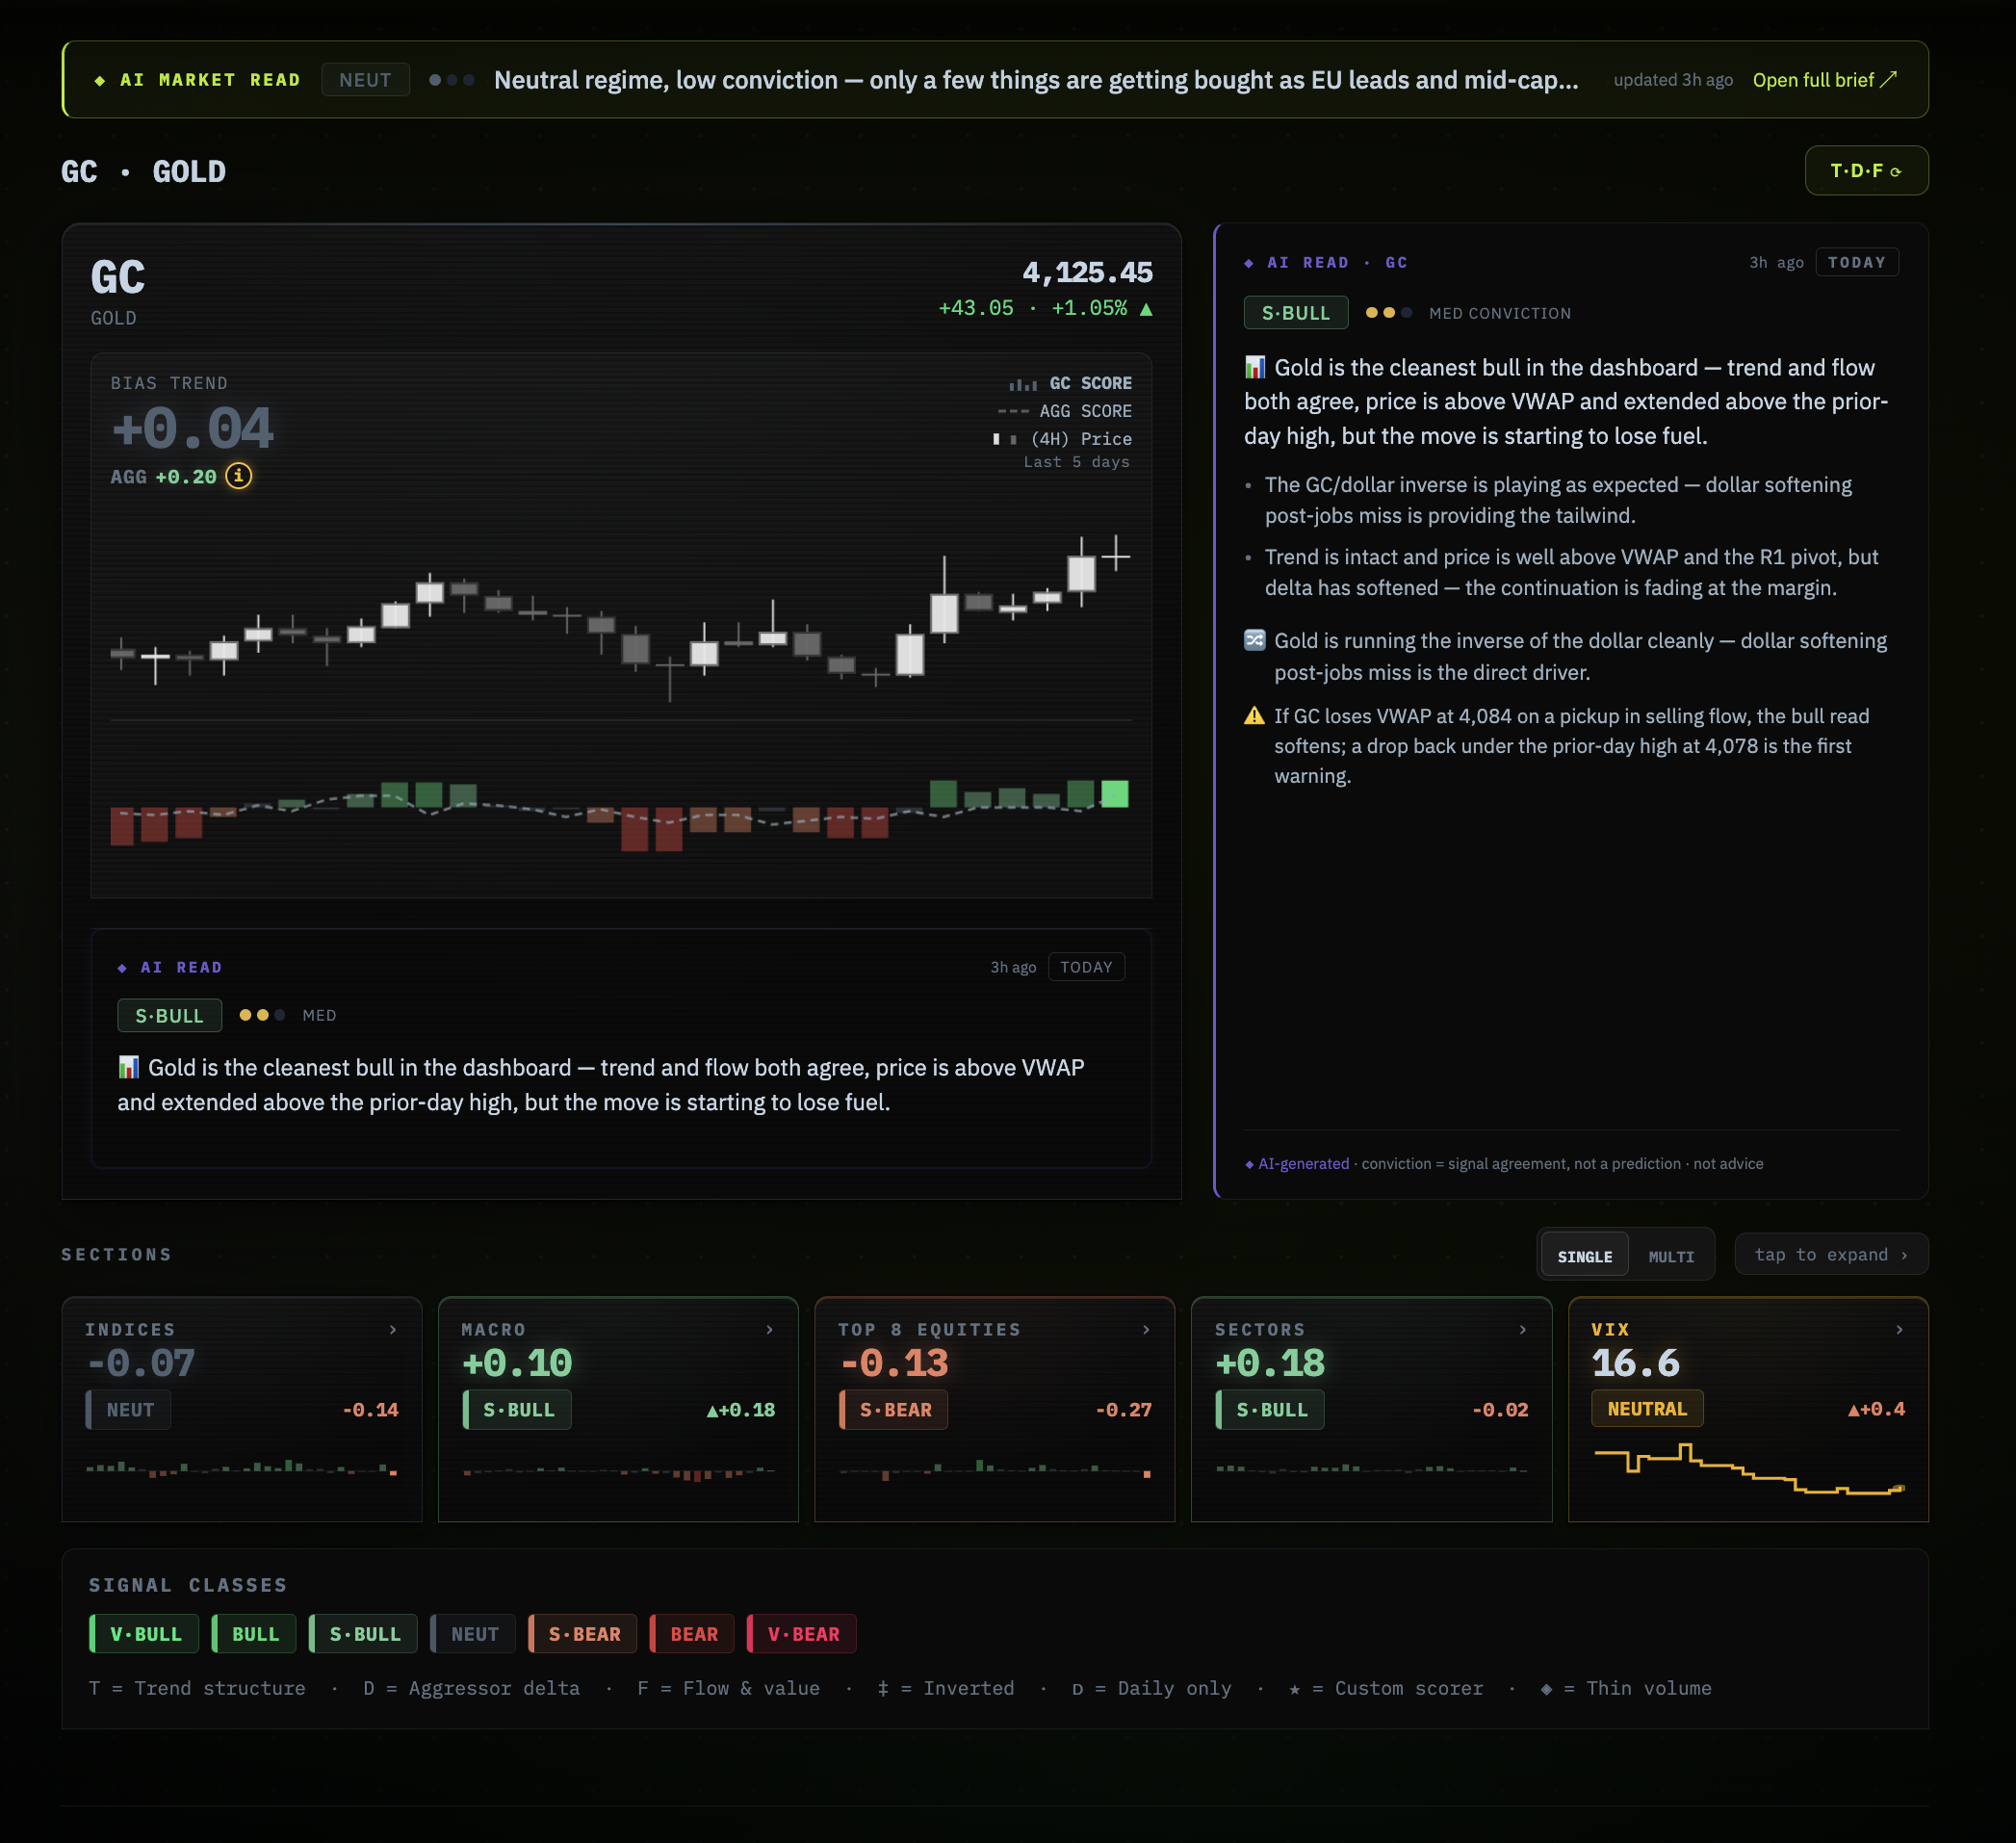
Every hero card carries a ◆ AI READ pill. Click it to expand the full instrument read inline — conviction level, what's driving the bias, price context against key levels (VWAP, prior-day high/low/close, pivots), and where the read would change if price or flow shifts.
The AI Read is spike-aware: if NQ is down 300 points on overnight data but trend and flow haven't confirmed, it says so. Price levels are in futures points — not percentages — the way a futures trader actually thinks about moves. Available on both desktop and mobile.
6 briefs per day, timed to CME sessions. Pauses on weekends, full holidays, and the nightly maintenance halt. Half-days carry a thin-liquidity caveat.
Reads factor in recent price moves. A sharp overnight reaction is never described as flat. Unconfirmed moves are flagged as such.
Futures vs cash. Overnight, sector commentary is framed as the last regular-session close — never as if ETFs are trading live.
Live price against VWAP, prior highs/lows, pivots — expressed in NQ points, crude $/bbl, gold $/oz. The units a futures trader uses.
Built for a specific trader.
Not every trader.
"The Matrix is market context. What you do with that context is your edge — not ours."
Open the Dashboard
The full Matrix is free to access during open beta, no credit card.
- ✓Full 32-instrument live dashboard
- ✓All four view modes
- ✓T · D · F scoring — all dimensions
- ✓FOR-X pairwise signals
- ✓Options Flow Skew — live
- ✓AI Brief — 6× daily session reads
- ✓AI Read — per-instrument on every card
- ✓7-day Time Replay
- ✓Discord community access
Know what the market
is doing before you do anything.
32 instruments. Three dimensions. Session-aware intelligence. Updated every 30 seconds, all session long.