What is the Market Bias Matrix?§
The Market Bias Matrix is a real-time market intelligence dashboard designed for futures traders who need to know the directional lean of the market before they enter a trade — not after.
At a glance, the Matrix provides:
- ·Live directional bias across indices, macro, top equities, and sectors — updated every 30 seconds from live market data
- ·Three scoring dimensions — price structure, institutional order flow, and market value context
- ·Pairwise context — what every instrument implies for NQ, ES, GC, YM, RTY, BTC, SI, and CL specifically
- ·Session-aware intelligence — signals that know whether it is 3am in Asia or 10am in New York
The engine runs continuously. Bias scores update every 30 seconds during active sessions and slow to a reduced cadence overnight. The dashboard reflects the current state of the market at all times — no manual refresh required.
Dashboard Overview§
The dashboard is organized from most important to most detailed:
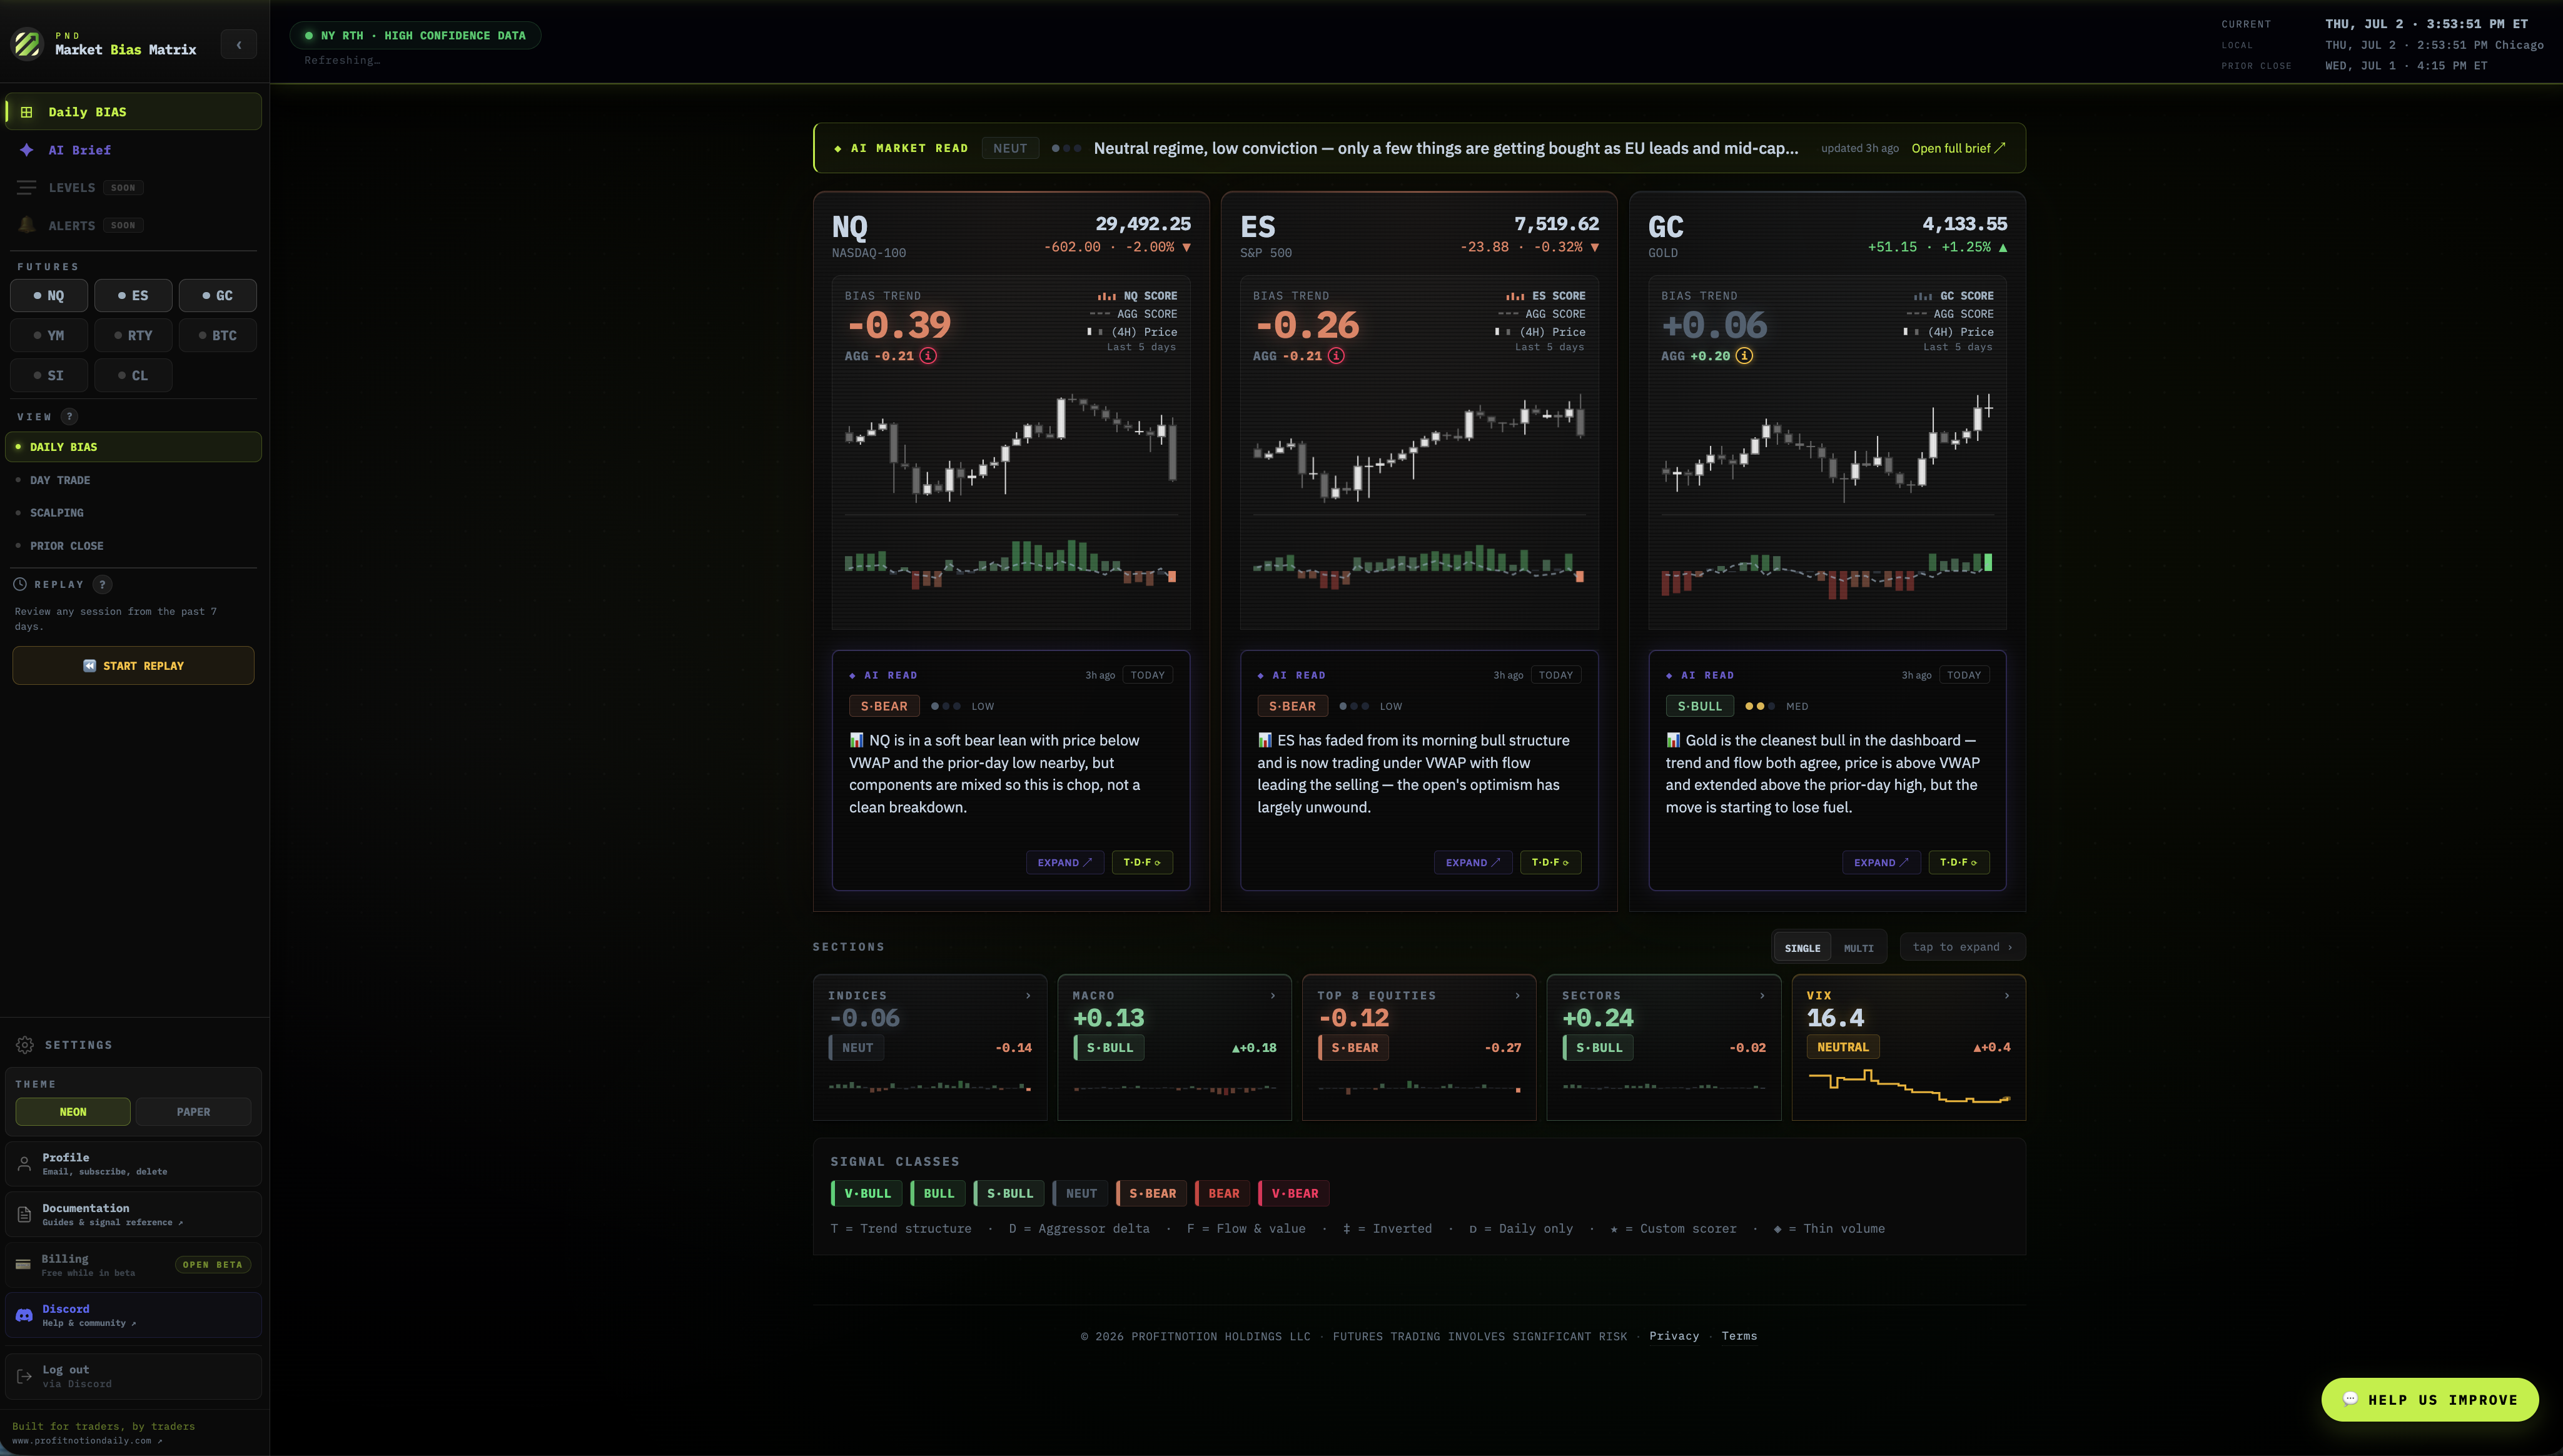
AI Market Read bar — a persistent banner at the top of the dashboard showing a one-line market regime summary, current signal class, and conviction. Clicking Open full brief → opens the complete AI Brief for the current session. See section 13 for full detail.
Sidebar — persistent left panel containing the view mode selector (Daily Bias / Day Trade / Scalping / Prior Close), session clock, Time Replay controls, and theme toggle.
Header — displays the active view name, a live pulse badge that confirms data is streaming, and the last-updated timestamp.
Hero cards — full-detail spotlight cards for eight primary instruments: NQ, ES, GC, YM, RTY, BTC, SI, and CL. Each card shows the bias signal, score trend sparkline, price delta, the full T·D·F breakdown, the D·T·S ladder, and the AI Read.
Section aggregates — one card per section (Indices, Macro, Top 8 Equities, Sectors, VIX) that shows the aggregate bias across all instruments in that group. The VIX card uses its own regime-based model and sits alongside the section aggregates.
Matrix rows — one row per instrument showing the signal class, aggregate score, T·D·F scores, FOR-X pairwise pills, and a Score Detail toggle that expands into the full sub-signal breakdown.
Signal Classes§
Every bias score maps to one of seven signal classes. The class determines the colour and label shown in the matrix. Scores run from −100 (maximum bearish) to +100 (maximum bullish), with thresholds that adapt slightly based on session activity.
| Signal | What it means |
|---|---|
| V·BULL | Very Bullish — all three dimensions aligned strongly to the upside. Broad participation, strong structure, buyers in control. |
| BULL | Bullish — clear upside lean with most signals confirming. A high-conviction directional read in normal conditions. |
| S·BULL | Softly Bullish — mild upside edge. One or more dimensions are mixed. Useful as a tiebreaker but not a high-confidence standalone signal. |
| NEUT | Neutral — no meaningful directional edge detected. Price, flow, and volume context are balanced or conflicting. |
| S·BEAR | Softly Bearish — mild downside lean. Some dimensions bearish, others mixed. Approach with caution on long setups. |
| BEAR·C | Bear Confirmed — clear bearish alignment across multiple dimensions. Selling pressure is real and structured. |
| V·BEAR | Very Bearish — maximum bearish signal. All dimensions aligned to the downside with strong conviction. Broad distribution or panic selling conditions. |
Neutral is real information. A NEUT reading does not mean the engine has failed to compute — it means the market is genuinely balanced. In many contexts, neutral is the correct bias: fade extremes, wait for a break.
Watch the direction of movement. A score that was BULL three hours ago and is now S·BULL is telling you something different from a score that moved the same direction but started at NEUT. The trend of the score matters as much as its current value.
Check the number, not just the label. Two instruments can both show BULL but one might score +42 and the other +78. The raw score gives you more precision when comparing instruments or deciding which setup has stronger backing.
The Four Views§
The Matrix can be switched between four views. The view mode controls the time window feeding the T (Trends) dimension and the D (Delta) trade window. F (Flow) factors — VWAP, Value Area, Opening Balance, and Volume Pace — are always anchored to the current session regardless of which view is selected. Switching views recalculates every instrument globally.
Daily Bias
T — Multi-day structural analysis spanning multiple sessions.
D — Last 3 RTH sessions, scored as a decay-weighted ratio (not an accumulated sum).
F — Current session.
The broadest lens. T captures where price structure has been building across days; D weights recent sessions more heavily so a sharp turn in the last session registers clearly without erasing prior context. Use this to establish the dominant directional lean before the open and to frame multi-day swing context.
Best for: pre-market planning, multi-day swing context, establishing the dominant directional lean before the open.
Day Trade
T — Daily structural analysis combined with 1-hour EMA alignment.
D — Today's RTH session from 9:30 ET to now. If queried before RTH open, uses the last 4 hours of Globex instead.
F — Current session.
The primary view for active intraday trading. T provides both daily structure and a medium-term momentum filter via the 1-hour EMA. D is tightly scoped to what has actually traded today, so the score reflects the session's developing character rather than yesterday's legacy flow.
Best for: intraday directional bias, entry confirmation, reading the session's developing structure.
Scalping
T — Day Trade T plus 15-minute EMA alignment layered on top.
D — Last 90 minutes of trades only.
F — 90-minute rolling window (not the full session).
The tightest window. T adds a short-term momentum filter to the day trade structure; D is limited to the most recent 90 minutes so the score reacts quickly to intrabar shifts in aggressor activity. Signals will flip faster than Day Trade — that is intentional. Expect more noise in slow or choppy conditions.
In Scalping view, the Flow (F) dimension uses a 90-minute window rather than the full session. Session VWAP is replaced by a 90-minute anchored VWAP, the Value Area reflects only the last 90 minutes of volume, and Volume Pace measures the last 30 minutes against a typical pace baseline. This means F can diverge from the Day Trade view — a session that is bullish overall can show bearish short-term flow if price has been fading in the last 90 minutes.
Options Flow Skew uses 0DTE options in Scalping view during RTH — the most reactive term structure, reflecting intraday positioning rather than multi-day structural bias.
Scalping and Day Trade will show similar readings in the first 90 minutes after the open, when both windows are covering approximately the same period. Divergence builds as the session progresses and the 90-minute scalp window separates from the session open.
Best for: short-duration momentum setups, scalp entries, rapid context shifts.
Prior Close
T, D, and F are all frozen at yesterday's 4:00 PM ET regular-hours close.
Scores do not update during the day. This makes Prior Close a stable reference point — not a live signal. Prior Close scores display with an amber visual treatment to distinguish them from the three live views and to reinforce that you are looking at a snapshot, not the current market.
Best for: overnight gap analysis, anchoring today's context against the prior session's final character.
Hero Cards — NQ · ES · GC · YM · RTY · BTC · SI · CL§
Hero cards sit above the main matrix and give the eight primary trading instruments a full expanded view. While every instrument in the matrix gets a scored row, these eight get a richer card with additional context layers — full T·D·F breakdown, bias trend sparkline, AI Read, and the D·T·S ladder across all view modes.
What is on a hero card
- ·Top strip — instrument name, current signal class pill, and the aggregate bias score. The strip background colour reflects the current signal class.
- ·Bias trend panel — a sparkline showing how the score has moved over the active session. The shape reveals momentum, reversals, and conviction.
- ·Price delta — the percentage change from the session reference point (open or prior close depending on view), displayed with directional colour.
- ·D·T·S ladder — three view-mode scores stacked vertically: Daily Bias, Day Trade, and Scalping. Seeing all three at once shows whether short-term and long-term bias are aligned or diverging.
- ·T·D·F breakdown — individual Trend, Delta, and Flow dimension scores shown with their own mini bars, so you can see which dimension is driving the overall signal.
Reading the sparkline
| Pattern | What to watch for |
|---|---|
| Rising line | Score is increasing — bias strengthening in the bullish direction. Momentum is with buyers. |
| Falling line | Score is declining — bias weakening or shifting toward bears. Worth investigating which dimension is leading the move. |
| Flat line | Score is stable. Market structure, flow, and volume are holding steady. A flat high score is strong conviction; a flat zero is genuine neutrality. |
| Reversal shape | Score peaked and is now turning. Early warning of a potential bias shift — not a signal on its own, but a prompt to re-examine the full T·D·F breakdown. |
How the Score is Built — T · D · F§
Every instrument's bias score is the weighted combination of three independent scoring dimensions:
T — Trends (price structure),
D — Delta (market aggressors), and
F — Flow (volume, order book and options context).
Each dimension scores independently on its own −100 to +100 scale before being blended into the final aggregate.
T — Trends
Where is price relative to where it has been?
The Trends dimension measures price structure — where price is sitting relative to a set of reference levels that define meaningful market context. Each reference level votes bullish or bearish based on whether price is above or below it, and the votes are weighted and combined into the T score.
Trend inputs are entirely price-based. No indicators, no moving average crossovers — just price relative to structure.
| What it tracks | Why it matters |
|---|---|
| Prior session close | The most fundamental reference. Trading above prior close is the definition of short-term bullish momentum. |
| Prior session H/L range | Is price inside or breaking out of yesterday's range? Position within the prior range is a key auction market input. |
| GEX zero-gamma level | The options gamma exposure level at which dealer hedging flips from dampening to amplifying price moves. A high-conviction structural reference used by institutional participants. |
| Today's session open | Is price holding above the open? Below the open suggests distribution has been occurring since the start of the session. |
| Floor pivot point | The classic daily pivot. Still widely referenced by pit traders and systematic participants. Above pivot = bullish lean. |
| Intraday range expansion | How far has price moved today relative to its typical daily range? Large expansions signal conviction; compression signals indecision. |
| Liquidity Pools Soon | Unfilled buy-side and sell-side liquidity clusters above and below price. Will be incorporated as additional T-dimension inputs. |
D — Delta
Who is actually hitting the market right now?
The Delta dimension measures order flow aggression — the net balance between buyers and sellers who are actively crossing the spread. Positive delta means more volume has been hitting the offer (buyers are aggressive). Negative delta means more volume has been hitting the bid (sellers are aggressive). This is the most real-time of the three dimensions.
| What it tracks | Why it matters |
|---|---|
| Net aggressor volume | The running total of buy-initiated minus sell-initiated volume over the active window. The core delta signal. |
| Big trades accumulation | Large trades — above a size threshold — are tracked separately. Institutional participation leaves a different footprint than retail noise. Weighted more heavily than small-lot flow. |
Delta inputs are session-weighted. During low-activity windows (overnight globex, pre-market), the D dimension carries less weight in the final aggregate because thin-market delta can be misleading. During RTH, delta carries full weight.
F — Flow
Is volume driving this price move — or is price moving on air?
The Flow dimension measures whether price is at accepted value or stretched away from it — and whether the options market is positioned in the same direction as price action.
It draws on the market's own volume profile (where the most business has been done), the session's VWAP structure, and the relative demand for calls vs puts in the options market. Together these three lenses tell you whether the current price level is one the market considers normal, whether it is likely to revert, and whether options participants are positioned with or against the current move.
In Scalping view, all Flow factors use a 90-minute rolling window instead of the full session — giving scalpers a short-term value read rather than the full-day picture.
| Factor | What it measures |
|---|---|
| Session VWAP | Price vs the volume-weighted average price. The most-watched intraday reference level globally. Above VWAP means buyers are in control. Below means sellers. |
| VWAP Dev Bands | How stretched price is from VWAP in standard deviation terms. Extended beyond ±1σ signals either a breakout with conviction or an overextension ripe for reversal. |
| Value Area | The 70%-volume zone for the session (VA High, VA Low, Point of Control). Inside = fair value. Outside = extension or breakout. |
| Opening Balance | The range set in the first 30 minutes of RTH (9:30–10:00 ET). Breaking above it = bullish trend signal. Failing inside it = balance/chop. |
| Volume Pace | Is today running above or below the typical volume for this time of day? High volume in the direction of price confirms the move. Low volume despite price moving signals a fragile, unconfirmed move. |
| Options Flow Skew | The relative demand for calls vs puts in the options market, measured by the delta risk reversal (DRR). Positive = options participants are bidding up calls relative to puts — bullish positioning. Negative = puts bid up relative to calls — bearish positioning. Weighted by the VIX regime: in calm markets (low VIX), index options are partly hedging instruments and the signal is down-weighted accordingly. In elevated volatility, options trade more directionally and carry full weight. |
Options Flow Skew is available for NQ, ES, GC, YM, RTY, ZN, BTC, CL, SI, and all Top 8 equities. It is not available for sector futures — partial coverage across the section would create misleading comparisons between instruments. When unavailable, the factor drops from the denominator and the remaining factors carry full weight automatically.
Order Book Skew Soon — real-time bid/ask imbalance from the limit order book will be added as the next F-bucket factor.
How the three dimensions combine
T, D, and F are blended into the final aggregate score using weights that vary by trading session — not by view mode. The view you select changes what data feeds T and D; the session-based weighting determines how much each dimension contributes to the final score. F modulates confidence rather than direction — it reinforces or tempers what T and D are already saying. The exact weights are recalibrated periodically as the engine is tuned against live market conditions.
The Matrix — 32 Instruments§
The main matrix table shows all 32 instruments arranged in four sections of eight. Each row displays the instrument ticker, any special markers, the current signal class, the aggregate bias score, individual T·D·F scores, and FOR-X pairwise pills (FOR-NQ, FOR-ES, FOR-GC) showing what that instrument's bias implies for each of the three primary instruments.
Column markers
| Marker | Meaning |
|---|---|
| ‡ inverted | This instrument's bias is inverted before being used in pairwise calculations. Example: USD is typically inverse to NQ — a bullish dollar is bearish for NQ. The ‡ marker signals the inversion is applied automatically. |
| ᴅ daily only | This instrument only has reliable data at the daily timeframe. It will not show updated intraday scores in Day Trade or Scalping views — the Daily Bias score is carried forward. |
| ★ custom scorer | This instrument uses a custom scoring model rather than the standard T·D·F pipeline. VIX is the primary example — its scoring logic reflects volatility regime rather than directional bias. |
| ◈ thin volume | Volume for this instrument is below threshold at the current time. Scores are shown but carry less reliability. Consider this when interpreting the signal. |
Score Detail toggle
Every row in the matrix has a Score Detail toggle (a small expand arrow on the right). Clicking it opens an expanded sub-row that shows all individual sub-signal votes — the raw inputs feeding into T, D, and F for that instrument. Each sub-signal is shown with its name, its current bullish/bearish vote, and its weight contribution. This is the deepest level of transparency available in the dashboard, useful for understanding exactly why an instrument is scoring where it is.
Sections & FOR-X Pairwise§
INDICES (8 instruments)
NQ · ES · GC · YM · RTY · EMD · NKD ᴅ · EU ᴅ — the core index and macro futures. This section is the most directly actionable for futures traders. NQ, ES, and GC are also hero instruments. YM (Dow) and RTY (Russell 2000) provide breadth context — when small caps diverge from large caps, it often signals a rotation or risk-off event. NKD (Nikkei) and EU (Euro Stoxx) are daily-only and provide overnight global context.
MACRO (8 instruments)
USD ‡ · ZN · VIX ★ · BTC · CL · SI · HG · 6J — cross-asset macro instruments. The dollar (USD) is inverted because dollar strength is generally bearish for risk assets. ZN (10-year Treasury futures) captures bond market sentiment. VIX uses a custom scorer. BTC, CL (crude oil), SI (silver), HG (copper), and 6J (Japanese yen) each contribute independent macro context that can confirm or contradict the index bias.
TOP 8 EQUITIES (8 instruments)
NVDA · AAPL · MSFT · TSLA · META · AMZN · AVGO · GOOG — the eight largest or most influential individual equities. Because these names make up a substantial weight of NQ and ES, their individual bias scores are among the most reliable leading indicators for index direction. When NVDA and MSFT diverge, it is often worth investigating why.
SECTORS (8 instruments)
XLK · XLF · XLY · XLE · XLV · XLI · XLP · XLU — SPDR sector ETFs covering Technology, Financials, Consumer Discretionary, Energy, Health Care, Industrials, Consumer Staples, and Utilities. Sector rotation is one of the most reliable reads of institutional risk appetite. Staples and Utilities leading is defensive — bearish for growth. Technology and Discretionary leading is risk-on.
AGG SCORE column
Each section has an aggregate score column that blends all eight instruments in that section into a single directional read. The section aggregate is not a simple average — instruments are weighted by their relevance to the primary instruments (NQ, ES, GC). This means a large move in NVDA will influence the Equities aggregate more than a move in XLU. The aggregate score is displayed at the top of each section header row and carries its own signal class pill.
FOR-X pairwise pills
Every instrument row shows three FOR-X pills: FOR-NQ, FOR-ES, and FOR-GC. These translate the instrument's own bias into its directional implication for each primary instrument, accounting for any inversion relationship. A BULL FOR-NQ pill on the USD row means the dollar's current position is bullish for NQ — which would only happen if the dollar is weak, since USD is an inverted instrument.
- ·Dollar (USD ‡) — inverted for NQ and ES. Dollar strength is a headwind for equities; dollar weakness is a tailwind.
- ·VIX ★ — inverted for all three primaries. Rising VIX implies fear, which is bearish for equities and bullish for gold as a safe haven.
- ·Yen (6J) — a classic risk-off currency. A strong yen often coincides with equity weakness and gold strength; the pairwise logic reflects this relationship.
- ·Defensive sectors (XLP · XLU) — when defensive sectors lead, the FOR-NQ and FOR-ES pills will reflect the risk-off implication even if the sectors themselves show bullish scores in isolation.
VIX Panel§
The VIX panel sits in the sidebar and provides a persistent volatility regime indicator. VIX (the CBOE Volatility Index) is one of the most important inputs for understanding the risk environment — it affects how you should interpret all other bias signals. A V·BULL NQ score means something very different in a 12 VIX environment versus a 35 VIX environment.
VIX regime levels
The VIX panel classifies the current VIX reading into one of six regimes: Extreme Greed · Risk-On · Normal · Caution · Fear · Panic. The regime boundary thresholds are not fixed — they are calibrated against the 52-week VIX range so that "Normal" always reflects the actual historical context of the current year rather than an absolute number.
Intraday direction
Alongside the regime level, the VIX panel shows the intraday direction of VIX — whether it is rising or falling during the current session. This is often more actionable than the absolute level: a VIX that is at 18 and falling is a very different environment from a VIX that is at 18 and rising sharply. Falling VIX during an equity rally confirms the move; rising VIX during an equity rally is a warning sign of underlying anxiety.
GC inversion
The VIX panel also shows how the current VIX regime affects the FOR-GC pairwise calculation. Gold typically benefits from fear — high VIX environments are bullish for GC even when equities are being punished. The GC inversion note in the VIX panel clarifies whether the current VIX regime is contributing a bullish or bearish FOR-GC translation across the matrix.
Sessions — When the Market is Open§
The Matrix is session-aware. Scoring weights, delta accumulation windows, and data reliability flags all adjust based on the current trading session. The session clock in the sidebar shows the active session and time remaining.
| Session | Window (ET) | Signal quality |
|---|---|---|
| Asia | 6:00pm – 11:00pm | Reduced. Thin volume on most US instruments. Structure inputs carry more weight than delta. |
| London open | 2:00am – 5:00am | Moderate. European participation increases volume. More reliable delta signals begin forming. |
| Pre-market | 4:00am – 9:30am | Building. Volume ramps into the US open. 8:30am economic releases can cause sharp moves. |
| RTH open | 9:30am – 11:00am | High. The most active and reliable window. All three dimensions carry full weight. |
| Midday | 11:00am – 1:30pm | Moderate. Lunch lull. Volume and delta can be lower and less reliable during this window. |
| Power hour | 3:00pm – 4:00pm | High. Institutional rebalancing and closing orders increase volume and signal reliability. |
| After hours | 4:00pm – 6:00pm | Reduced. Equity-specific flow from earnings releases may be present; index signals quieter. |
When the market is closed (weekends, holidays), the Matrix continues to display the last computed scores with a "Market Closed" indicator. Scores do not update but remain visible as reference. The next session start time is shown in the sidebar countdown.
Pre-market 8:30–9:30 ET is a particularly important window. Major economic releases (CPI, NFP, FOMC) drop at 8:30am and can cause large moves in both the futures and the underlying bias scores before RTH opens. Watching the Matrix during this window can give you early directional context before the open.
Time Replay§
(Desktop only — mobile shows a link to open on a larger screen)
Time Replay lets you step back to any point in recent history and see exactly what the Market Bias Matrix looked like at that moment — every score, every signal class, every pairwise pill — as it appeared live. It is one of the most powerful tools for post-session analysis and learning.
How to use it
- In the sidebar, find the REPLAY section and click ⏪ START REPLAY to enter replay mode.
- Pick a date from the date picker. The calendar shows available replay dates (typically the last 90 days, expanding over time).
- Use the session anchor buttons — OPEN · MID · CLOSE — to jump instantly to the market open, midday, or close for that session.
- Fine-tune with the timeline slider to move minute-by-minute through the session and watch the scores evolve in real time.
- Click → BACK TO LIVE in the amber banner that appears at the top of the page to exit replay and return to the live dashboard.
Amber mode
When Time Replay is active, the entire dashboard shifts to an amber visual treatment — the live pulse badge changes to an amber "REPLAY" indicator, the header background warms, and the sidebar shows the replayed timestamp. This makes it impossible to confuse historical scores with live data.
What replay is good for
- ·Post-session review — go back and see what the Matrix was signalling at the exact moment you entered or exited a trade. Was the bias aligned? Was there divergence you missed?
- ·Studying setups — replay a known high-quality setup and study how the Matrix scores built, peaked, and unwound. Build intuition for what a good bias environment looks like before the trade.
- ·Sharing moments — replay a key market moment, screenshot the Matrix state, and share it in the community as context for a trade idea or discussion.
Mobile Experience§
The Market Bias Matrix is fully usable on mobile. The layout adapts to a stacked, touch-friendly design with the following mobile-specific behaviors:
- ·Hero carousel — NQ, ES, and GC hero cards stack into a horizontally swipeable carousel so the full card detail is accessible without horizontal scrolling.
- ·Section grid — the matrix rows condense into a compact grid view showing ticker, signal class, and aggregate score. Tapping a row expands the T·D·F detail and FOR-X pills inline.
- ·Filters — a filter bar lets you show only bullish signals, only bearish signals, or a specific section (Indices, Macro, Equities, Sectors) to focus the view on what matters most.
- ·Bottom navigation — view mode switching, VIX regime, session status, and theme toggle are accessible from a persistent bottom navigation bar so the sidebar's functionality is not lost on small screens.
- ·Time Replay — not available on mobile due to the complexity of the timeline interface, but a prompt appears linking to the desktop version so you can quickly switch devices.
AI Brief & AI Read§
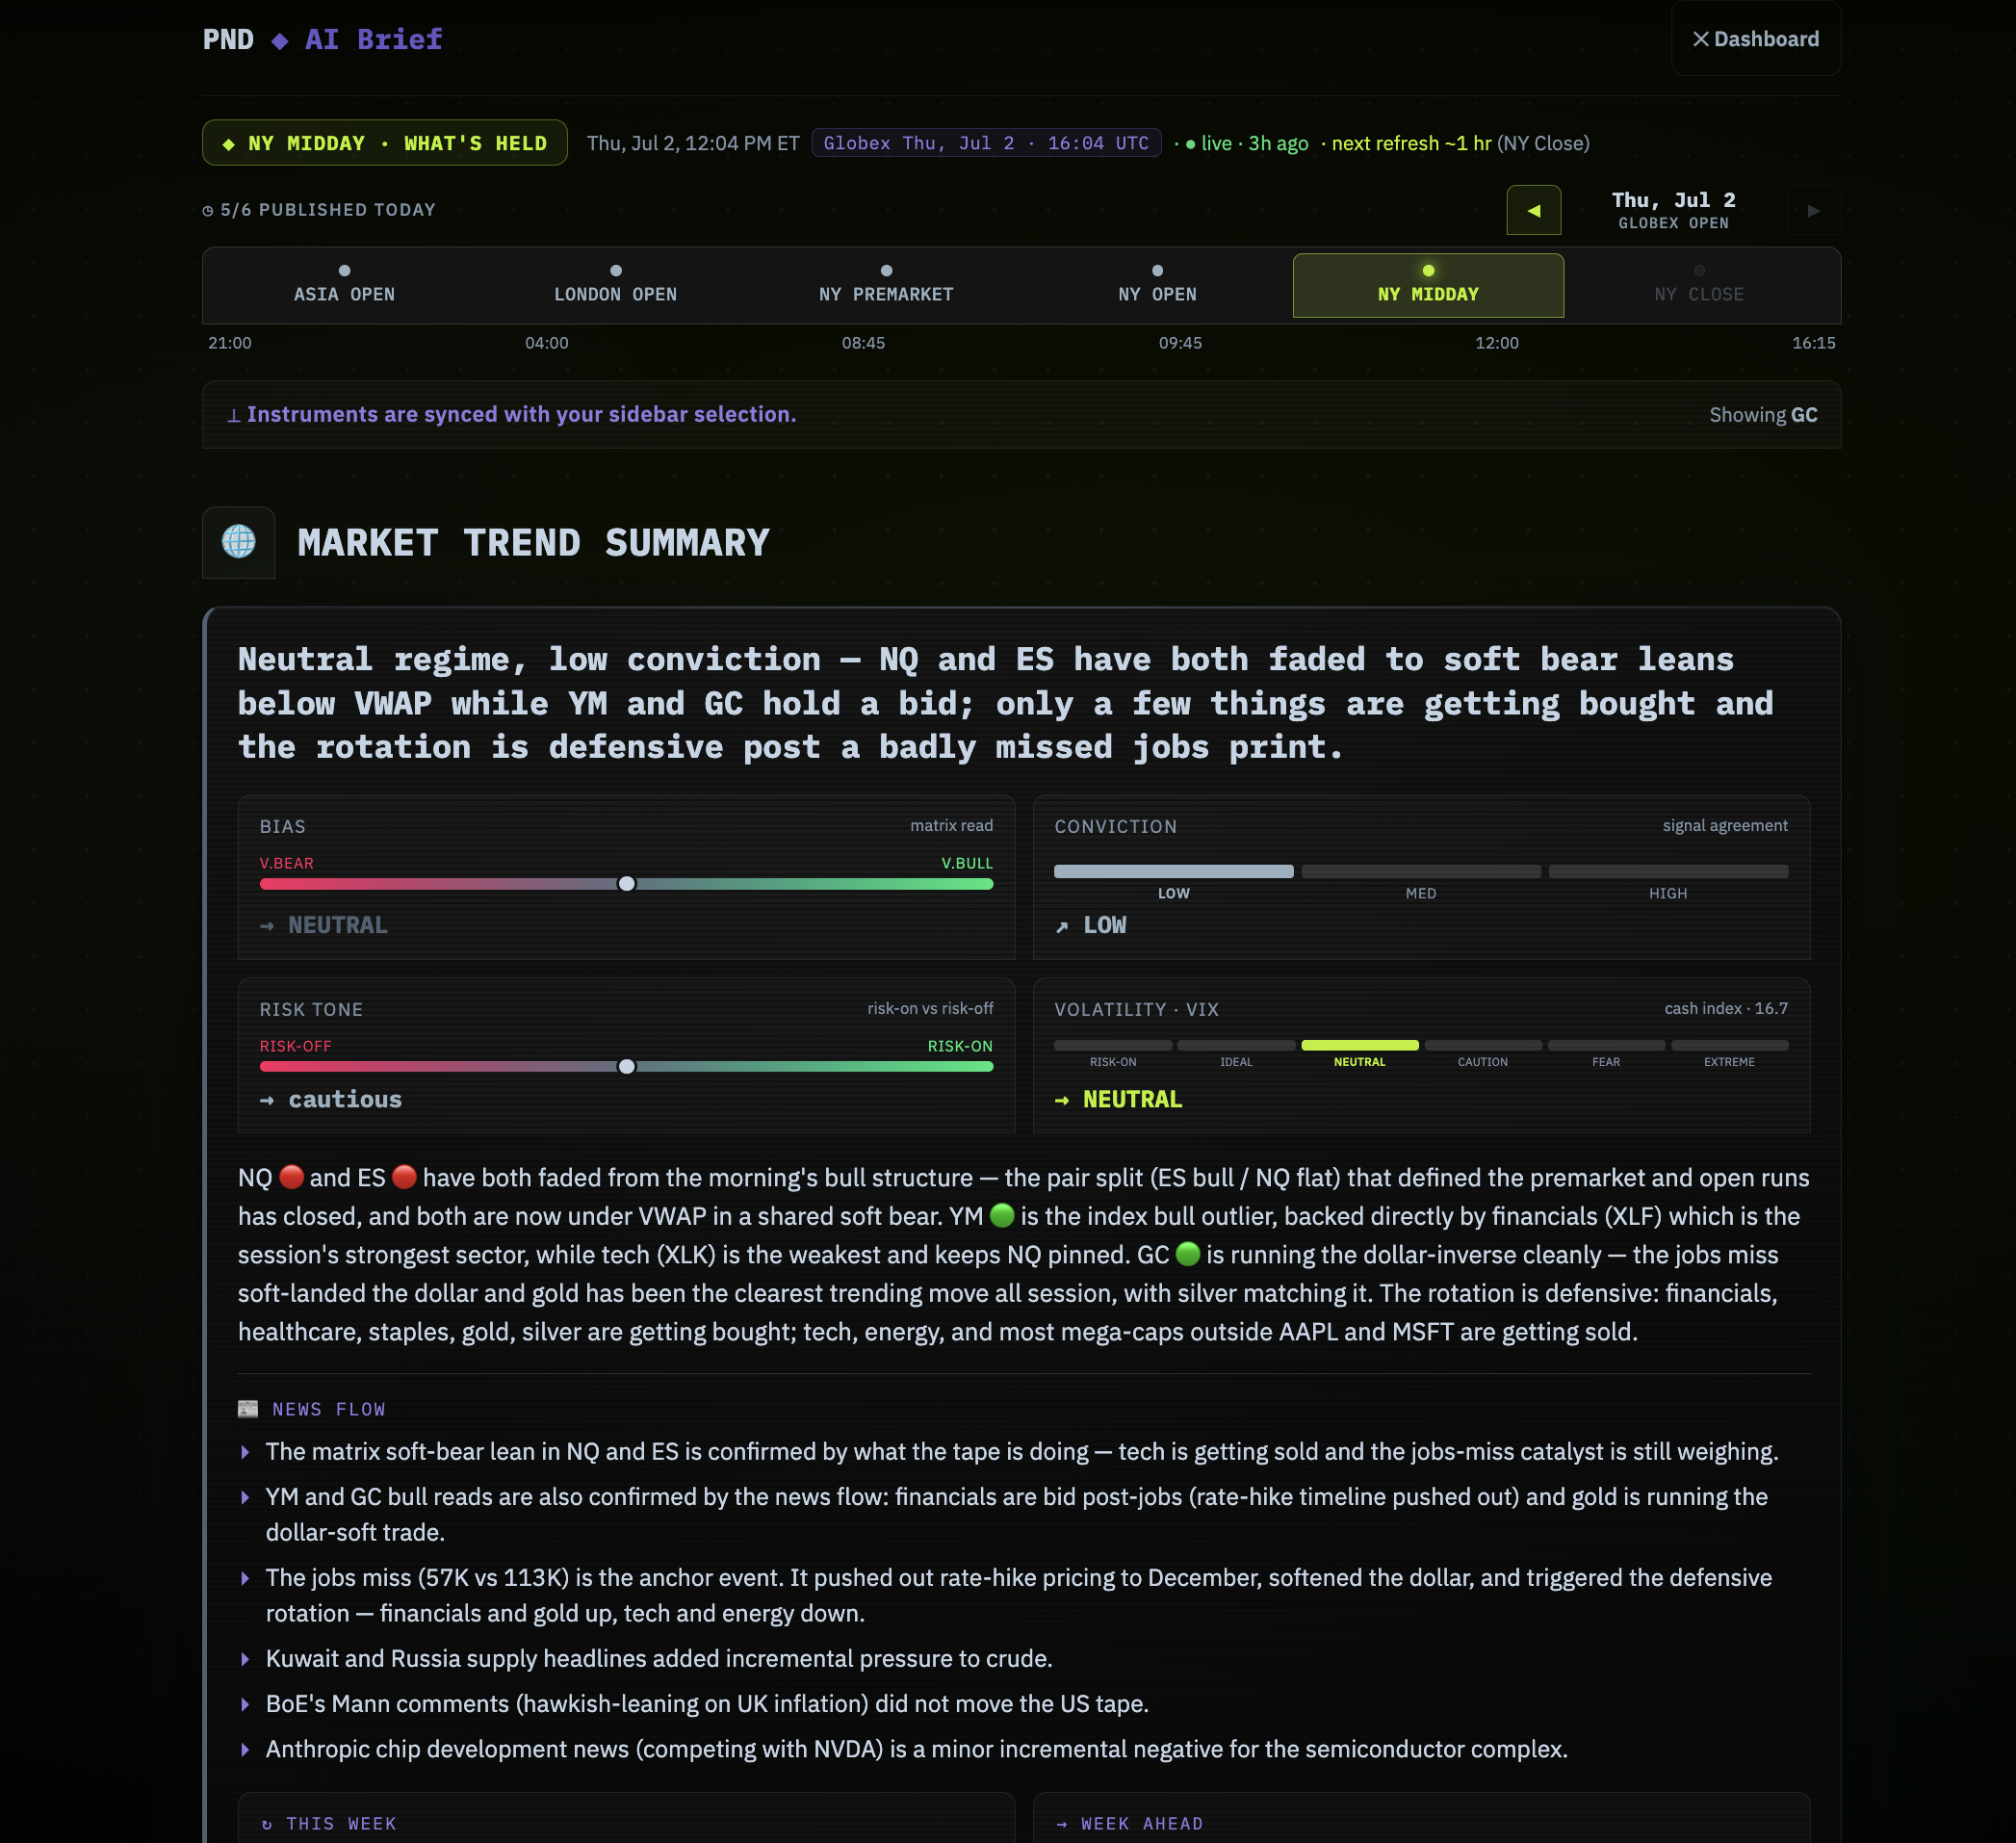
The AI Brief is a server-generated, AI-written market read published on a session cadence. It covers the full board — market regime, risk tone, conviction, VIX band, and rotation picture — plus a per-instrument read for every hero card instrument: NQ, ES, GC, YM, RTY, BTC, SI, and CL. The per-instrument AI Read pill visible on each hero card is a slice of the same brief, surfaced inline.
Publishing schedule
Briefs publish six times per trading day, timed to CME session openings:
| Session | Publishes (ET) |
|---|---|
| Asia Open | 9:00 PM |
| London Open | 4:00 AM |
| NY Premarket | 8:45 AM |
| NY Open | 9:45 AM |
| NY Midday | 12:00 PM |
| NY Close | 4:15 PM |
The schedule is tied to the live CME trading calendar. No briefs are published on weekends, full exchange holidays, or during the nightly maintenance halt (5:00–6:00 PM ET). On early-close half-days (e.g. July 3), briefs publish through the NY Open session, then pause for the remainder of the day — and those briefs carry a thin-liquidity, early-close caveat.
What the AI Brief contains
Market Trend Summary — the top-level regime read: bias direction (V·BULL through V·BEAR), conviction (Low / Med / High), risk tone (risk-on vs risk-off), and VIX band. Always names what NQ and ES are doing. Written as a full-paragraph narrative, not bullets.
Per-instrument reads — Daily Bias, Day Trade, and Scalping horizons for each of the eight hero instruments. Each horizon is a genuinely different read, not the same text reformatted. The Daily Bias read covers multi-session structure; the Scalping read reflects the last 90 minutes of aggressor activity.
News flow — recent market headlines with colored sentiment dots (bull / bear / neutral), sourced from live market news. The AI never fabricates events — if there is nothing to report, the section is omitted.
Economic calendar — upcoming events for the session, shown as plain-language bullets with risk / neutral sentiment. Colored by expected market impact.
Everything Else — a sentence-level read for every non-pinned instrument in the matrix (all 32 instruments get coverage across the Brief and the hero reads).
Progressive context — later briefs in the day build on what earlier sessions established. The NY Midday brief references what the Asia and London opens said, so the read develops as the day progresses rather than resetting each session.
Charts — each instrument read includes a price chart with the Daily, Day Trade, and Scalping timeframes and key levels overlaid.
Disclaimer — every brief ends with: "AI-generated · conviction reflects signal agreement, not a prediction · not financial advice."
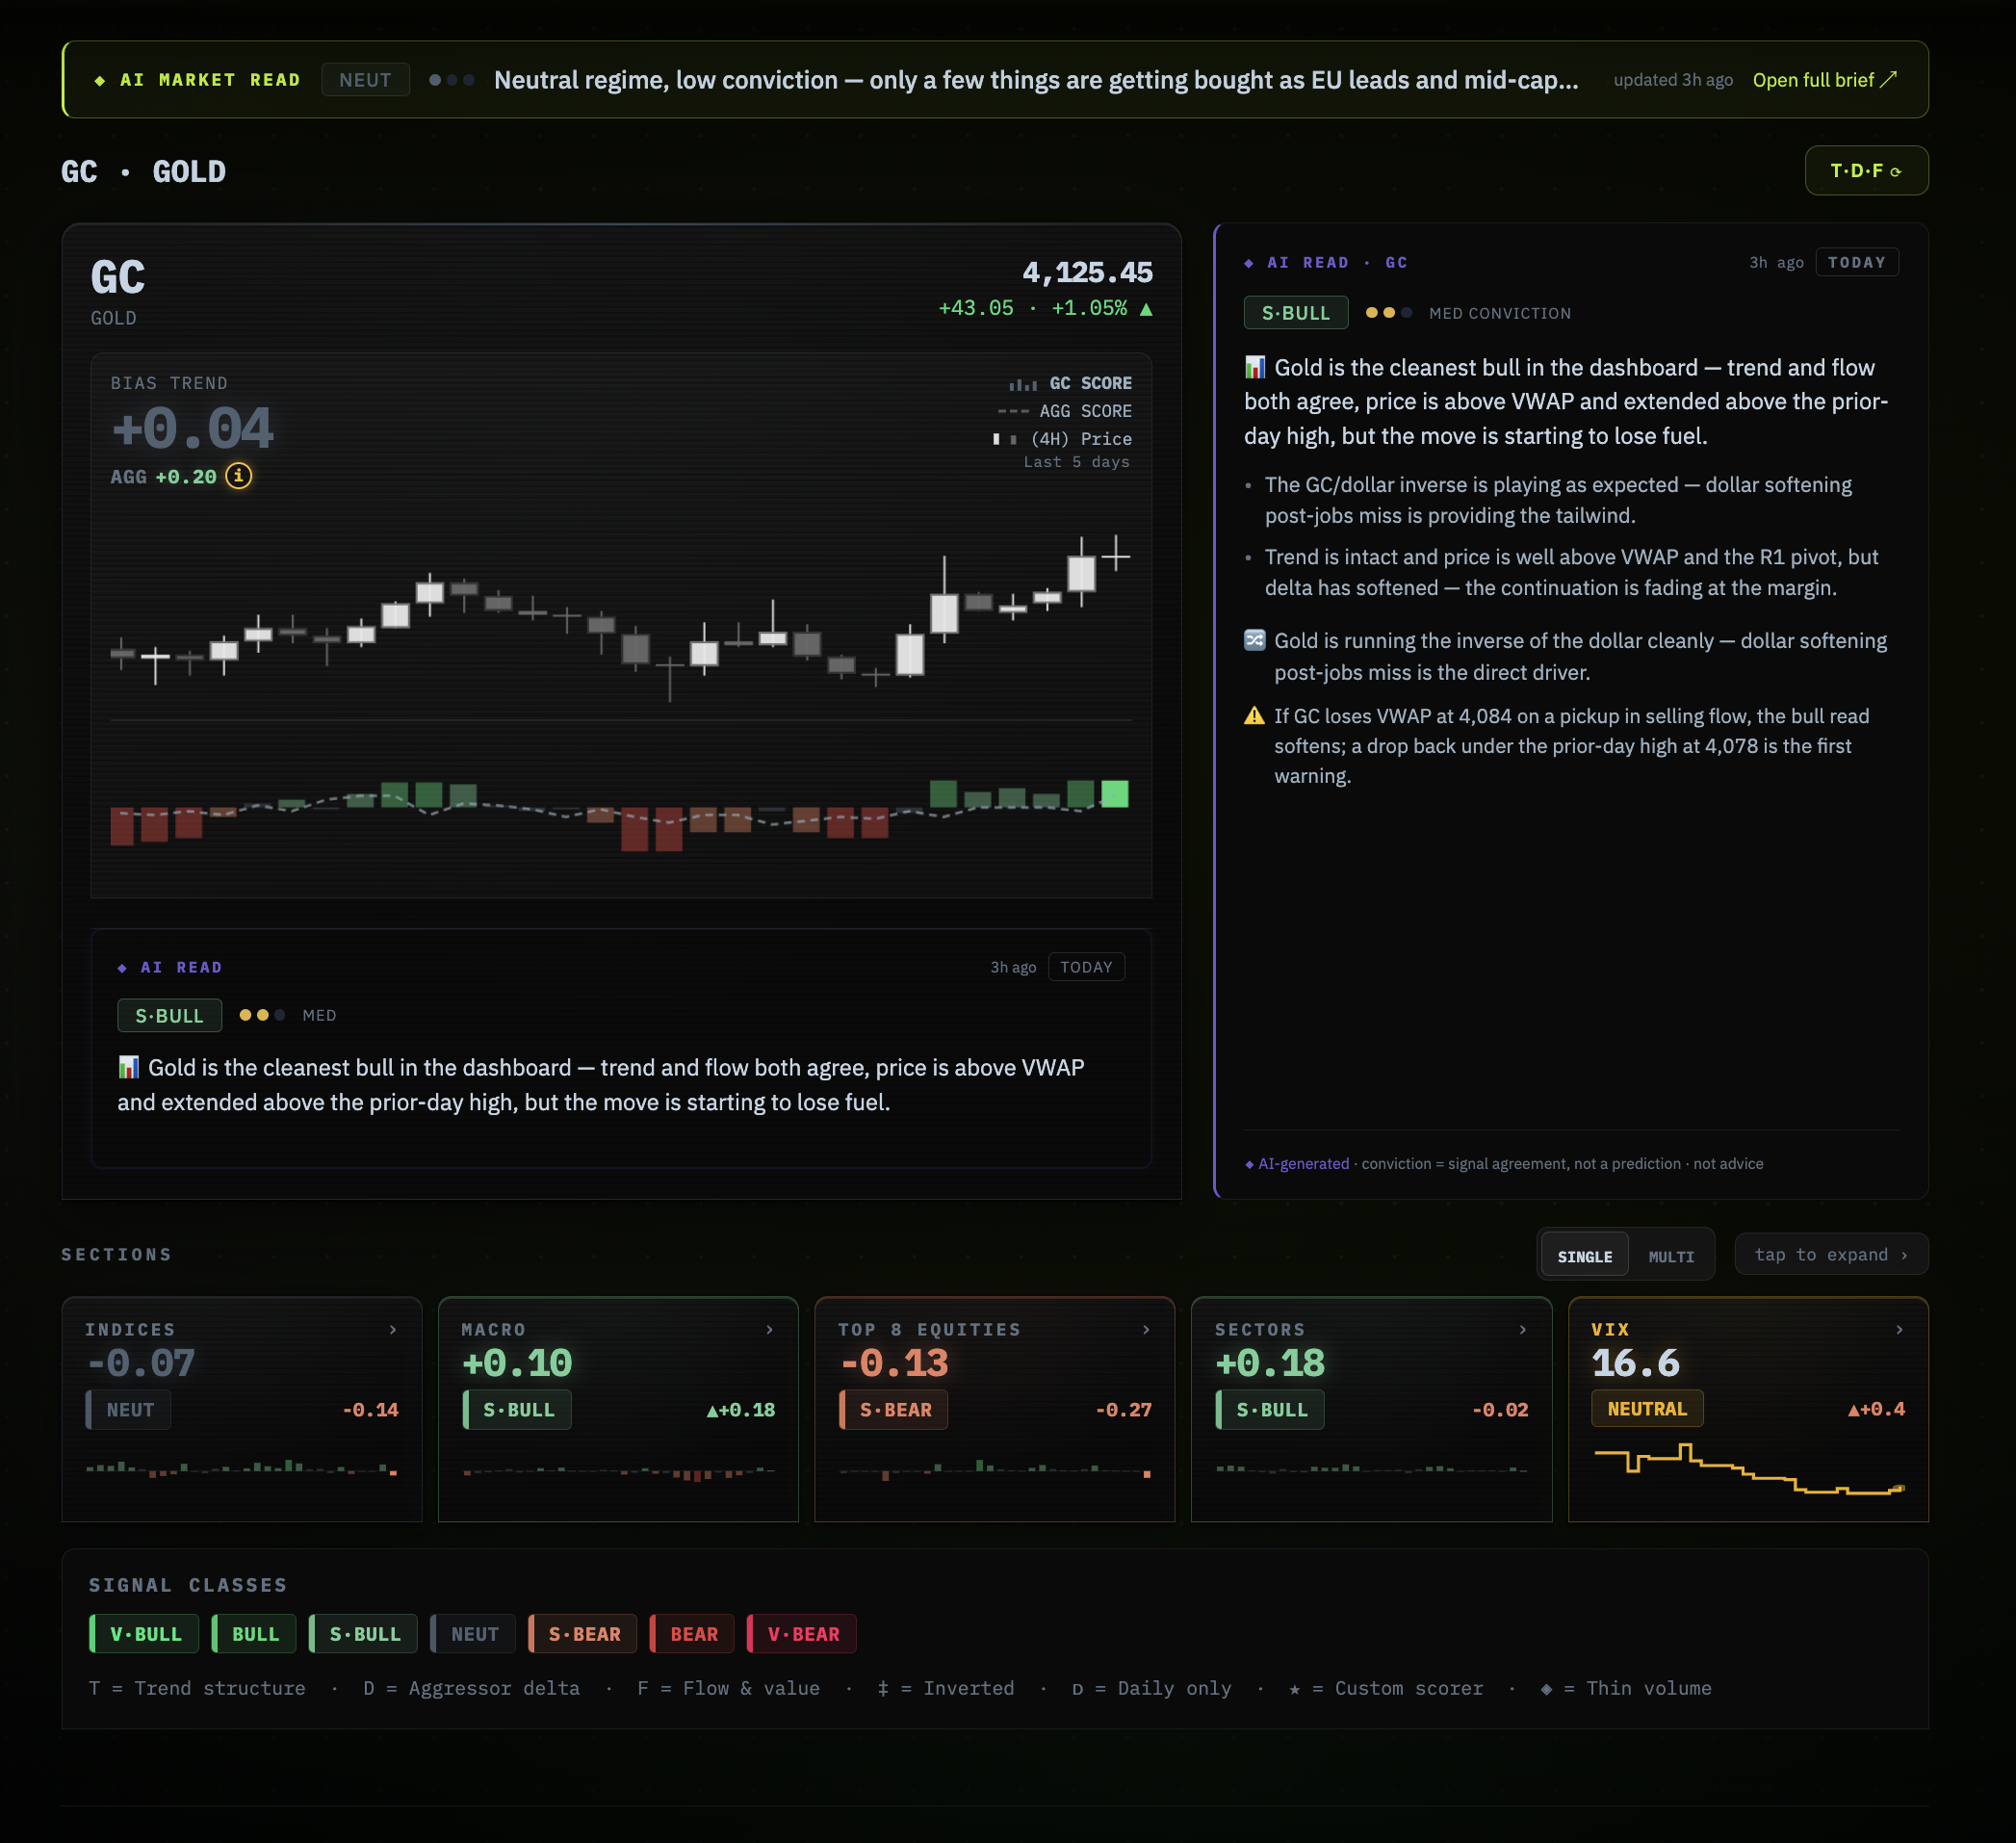
AI Read — per-instrument on every hero card
Every hero card carries a ◆ AI READ pill (bottom-right of the card on desktop; tappable inline on mobile). Clicking or tapping it expands the full instrument read directly in the card slot — conviction level, what's driving the bias, price context against key levels, and where the read would change if price or flow shifts.
Spike-aware reads
Each instrument read factors in the recent price move against what the underlying T·D·F signal is doing. A sharp reaction to overnight news is never described as "flat." If price moved but the signal hasn't confirmed yet, the read says so explicitly — e.g. "NQ's down almost 300 points on the overnight data, though trend and flow haven't turned to back it."This prevents the read from lagging a fast-moving market.
Session & market-hours awareness
The Brief distinguishes between instruments that trade 24 hours (NQ, ES, GC, and other futures) and instruments that trade only during regular cash hours (9:30 AM–4:00 PM ET) — sector ETFs, equities. Overnight, futures reads are live. Any sector or equity commentary is framed as "the last regular-session close" — never as if those instruments are trading live. Holiday sessions carry a thin-liquidity caveat and the read leans toward lower conviction.
Price in points
Reads are anchored to the live Databento price against key structural levels — VWAP, prior-day high/low/close, daily pivots, and recent range extremes. Magnitudes are always expressed in points and native units: NQ index points, crude dollars-per-barrel, gold dollars-per-ounce — the units a futures trader uses internally, not percentages. The price and change shown on the card are not restated in the read; instead the read uses those levels as confirmation or contradiction of the trend, delta, and flow picture.
Themes§
The Matrix supports two visual themes, switchable from the sidebar or the mobile bottom navigation. The selected theme persists across sessions via local storage. Both themes display the same data — only the visual presentation changes.
NEON PUNCH — the default dark theme. Black background with lime green (#A8E828) signal accents and a high-contrast signal colour scale from vivid green (V·BULL) to deep red (V·BEAR). Designed for extended viewing in low-light trading environments and optimised for at-a-glance signal recognition.
PAPER — a light theme using off-white backgrounds and muted ink-on-paper styling. Signal colours are adapted for legibility on light backgrounds. Preferred by traders who work in bright environments or want a less visually intense option during longer analysis sessions. The signal class pills and score bars retain their directional colour meaning but at softer intensity.
What's Coming Next§
The Market Bias Matrix is under active development. The features below are in various stages of design and engineering. If something here matters to your workflow, let us know in the Discord — community feedback directly shapes the build order.
Levels — GEX & Liquidity Soon
A dedicated levels overlay showing GEX (gamma exposure) strike levels and liquidity pool clusters plotted against price. These levels will be shown for NQ, ES, and GC and will update intraday as options market maker positioning shifts throughout the session.
Liquidity Pools scoring Soon
Liquidity pool positions above and below price will be incorporated as additional T-dimension inputs for all matrix instruments. When price is approaching a large unfilled buy-side or sell-side pool, the Trend score will reflect the magnet-like pull these levels can exert on price.
Order Book Skew scoring Soon
Real-time bid/ask imbalance from the limit order book will be added as an F-dimension input. A heavily skewed order book is predictive of short-term price direction. This input will make the Scalping view significantly more responsive and will be most impactful for the primary futures instruments.
Options Flow Skew ✓
Delta risk reversal from the live options market is now a live F-bucket factor for NQ, ES, GC, YM, RTY, ZN, BTC, CL, SI, and all Top 8 equities. Measures relative call vs put demand with VIX regime weighting.
Alerts Soon
Push and email alerts when an instrument's bias signal crosses a threshold, flips direction, or reaches a signal class you specify. You will be able to set alerts per instrument, per view mode, and per signal class — for example, "alert me when NQ Day Trade crosses into BULL or above."
90-Day Replay Soon
Time Replay currently provides access to recent history as data accumulates. The 90-Day Replay expansion will provide a full rolling 90-day history window, giving traders access to a wider range of market conditions for backtesting their read of the Matrix signals against their trade history.
Chart Indicators Soon
The Matrix score is powerful on its own — but it's even more useful when it's directly on your chart. We're building native indicators that bring the bias score, signal class, and T · D · F dimensions into ATAS/X, TradingView, and other widely-used platforms. See the confluence between what the Matrix says and what price is doing, without switching screens.
FAQ§
Glossary§
Scores update every 30 seconds · All times Eastern (ET)
Questions? Join the Discord community.