Your Futures Desk.
Market Bias Simplified.
Eleven futures ranked by bias — NQ, ES, GC, YM, RTY, BTC, SI, CL and the bond curve. The session brief written. The setups drafted. The order flow and options flow underneath. One screen, live from Globex open to the NY close.
The full walkthrough, surface by surface
A chart shows you price.It doesn't show you the market.
You trade NQ. But NQ doesn't move alone — the dollar, bonds, VIX, sector rotation and the top Nasdaq names all push on it, every session. A chart tells you what price is doing. It doesn't tell you who is doing it, whether the rest of the market agrees, or what the plan is if it turns.
Eleven futures, four market groups and VIX, each on its own chart, is noise. The Bias Desk puts them on one board and tells you which way the whole desk is leaning — and whether the groups agree.
Price tells you what. Order flow tells you who. Flow and options tell you whether it's real. Trend, Delta and Flow are scored separately, so you can see when they agree and when they don't.
The read changes six times a day and the setups change with it. The desk writes both down as they happen, so you can check what was said before the move — not after.
One desk. Four surfaces live,two on the way.
The Scoreboard scores it. The Session Brief writes it. Trade Ideas turn it into setups. Delta Levels show the order flow underneath. Exposure Map and Desk Analyst are next. Everything reads from one engine, so no two surfaces ever describe the market differently.
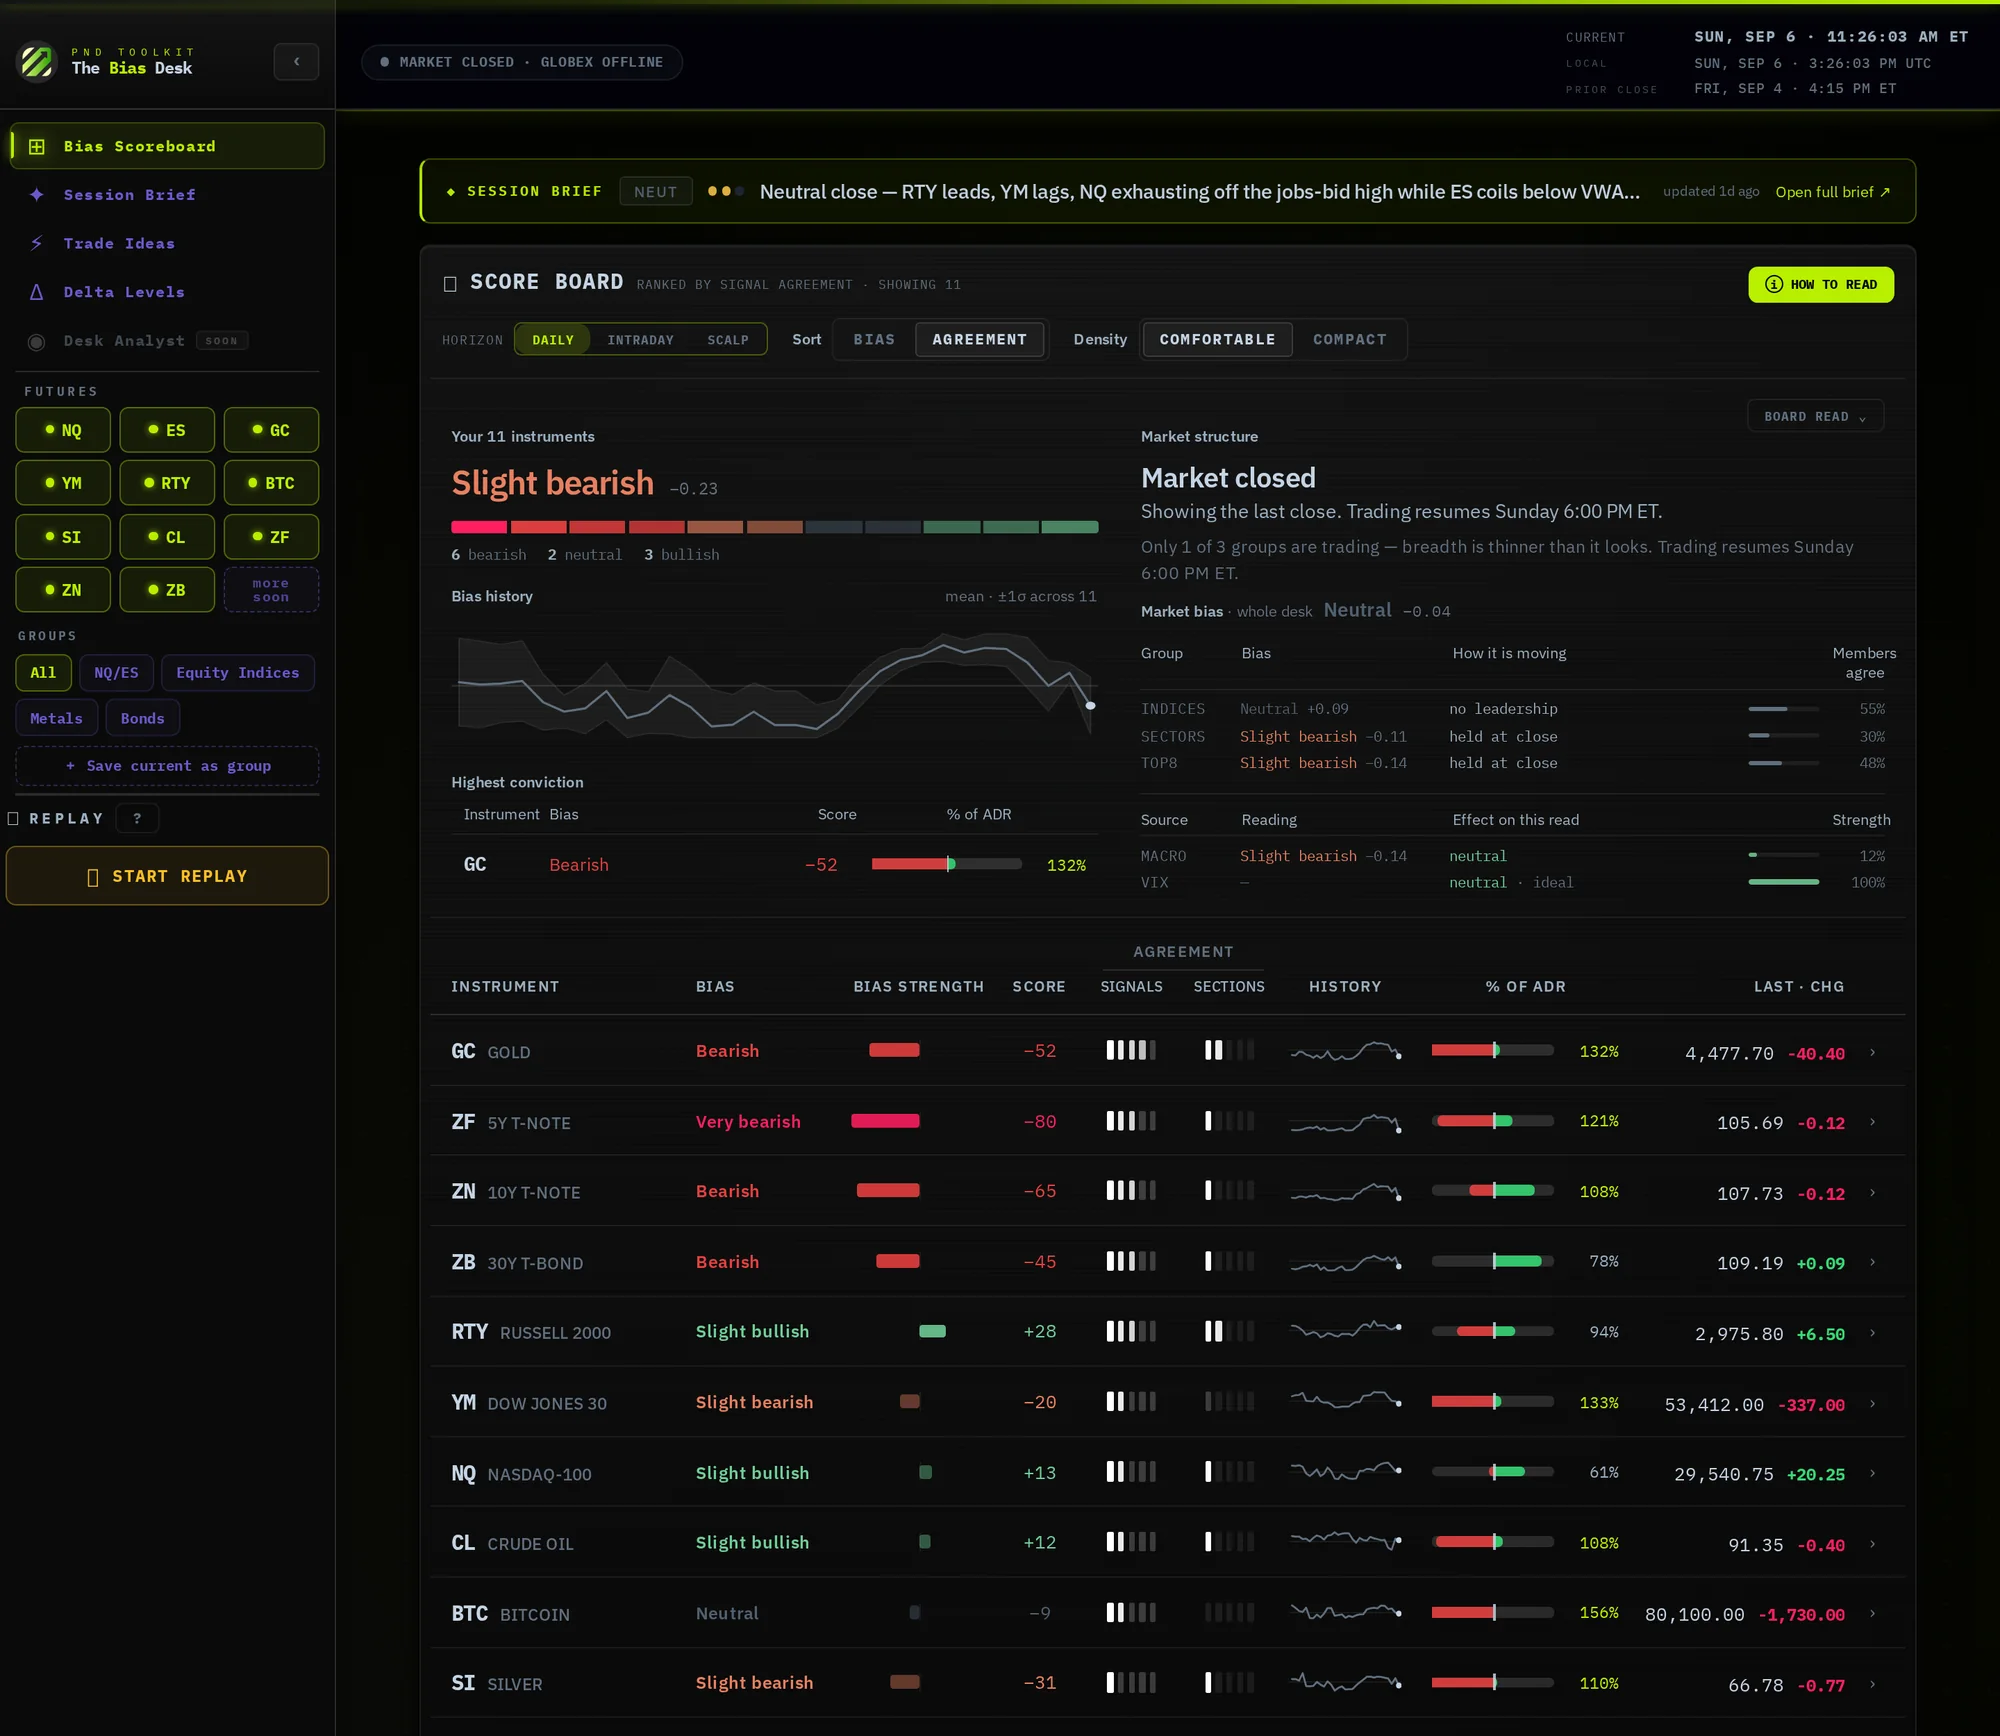
Bias Scoreboard
Every market you trade, ranked by how clearly it is leaning.
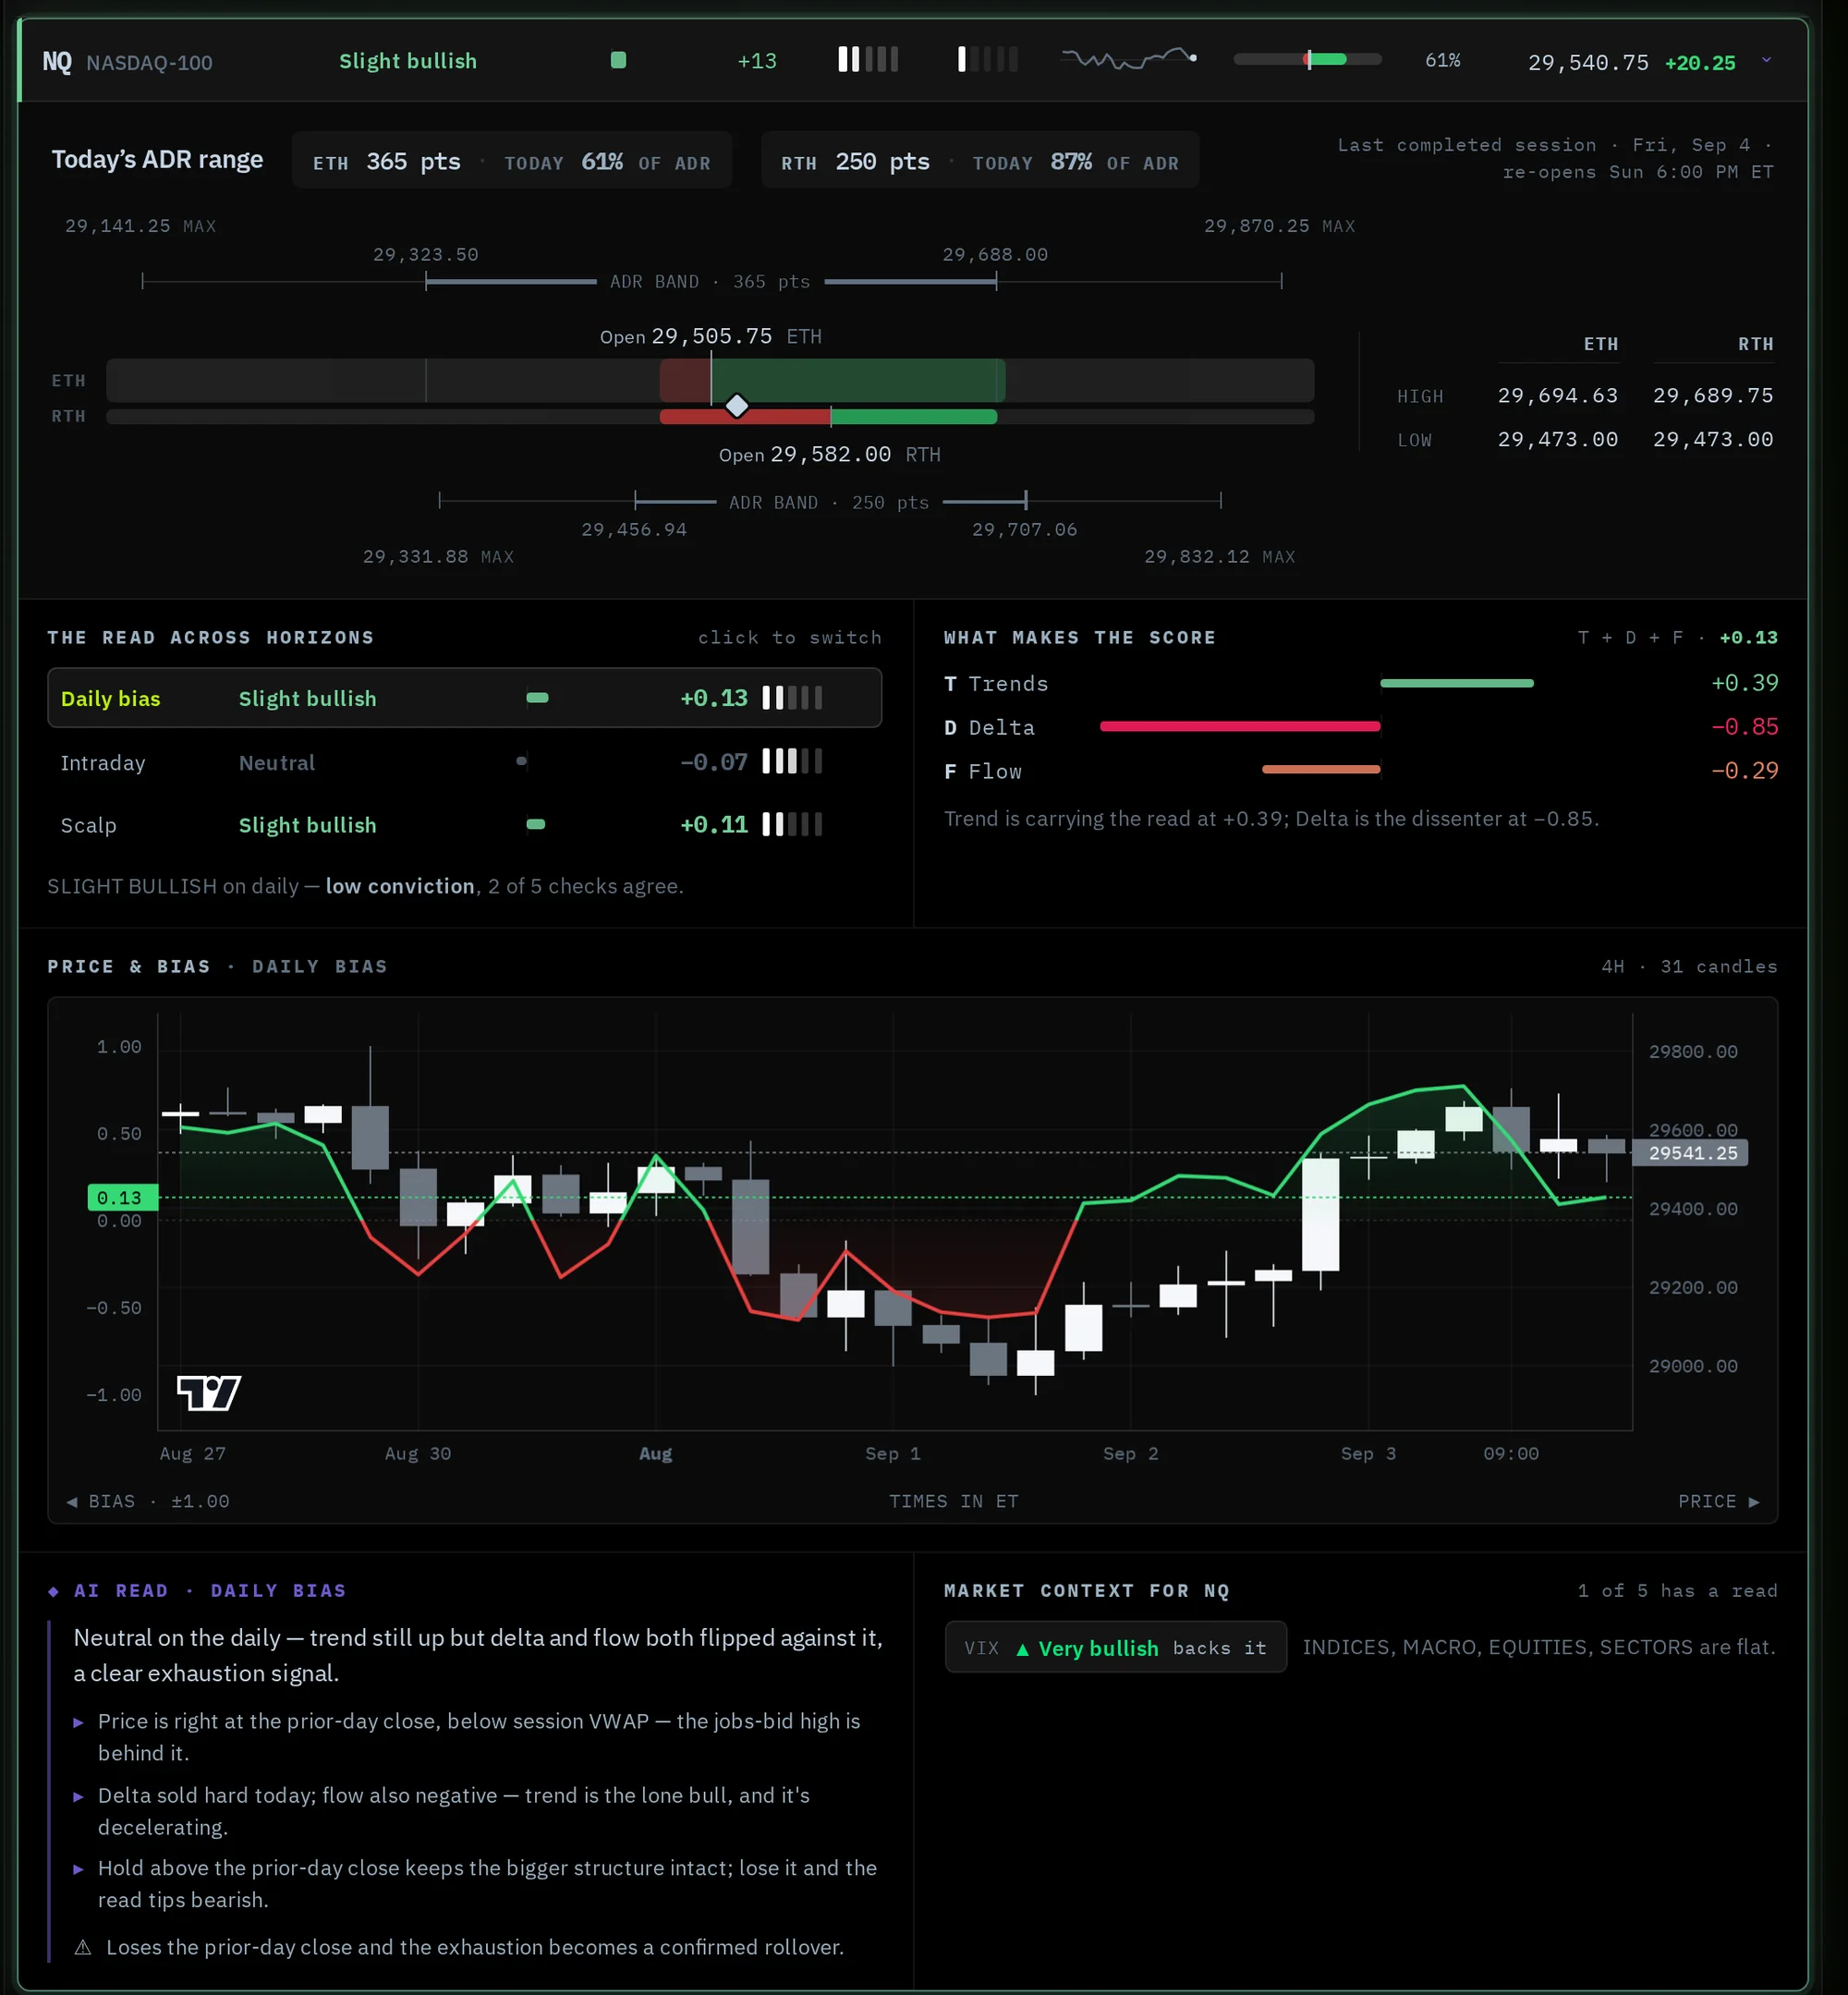
Eleven futures on one board — NQ, ES, GC, YM, RTY, BTC, SI, CL and the Treasury curve — each with a bias in words, a score from −100 to +100, how many of five independent checks agree, and how far it has already travelled against a normal day's range. The clearest reads sit at the top. Open any row for the price-and-bias chart, the breakdown behind the score, and a written AI read.
- ✓Ranked by signal agreement or by bias
- ✓Daily · Intraday · Scalp horizons
- ✓% of ADR, history and live price on every row
- ✓Four market groups and VIX beneath the board
Session Brief
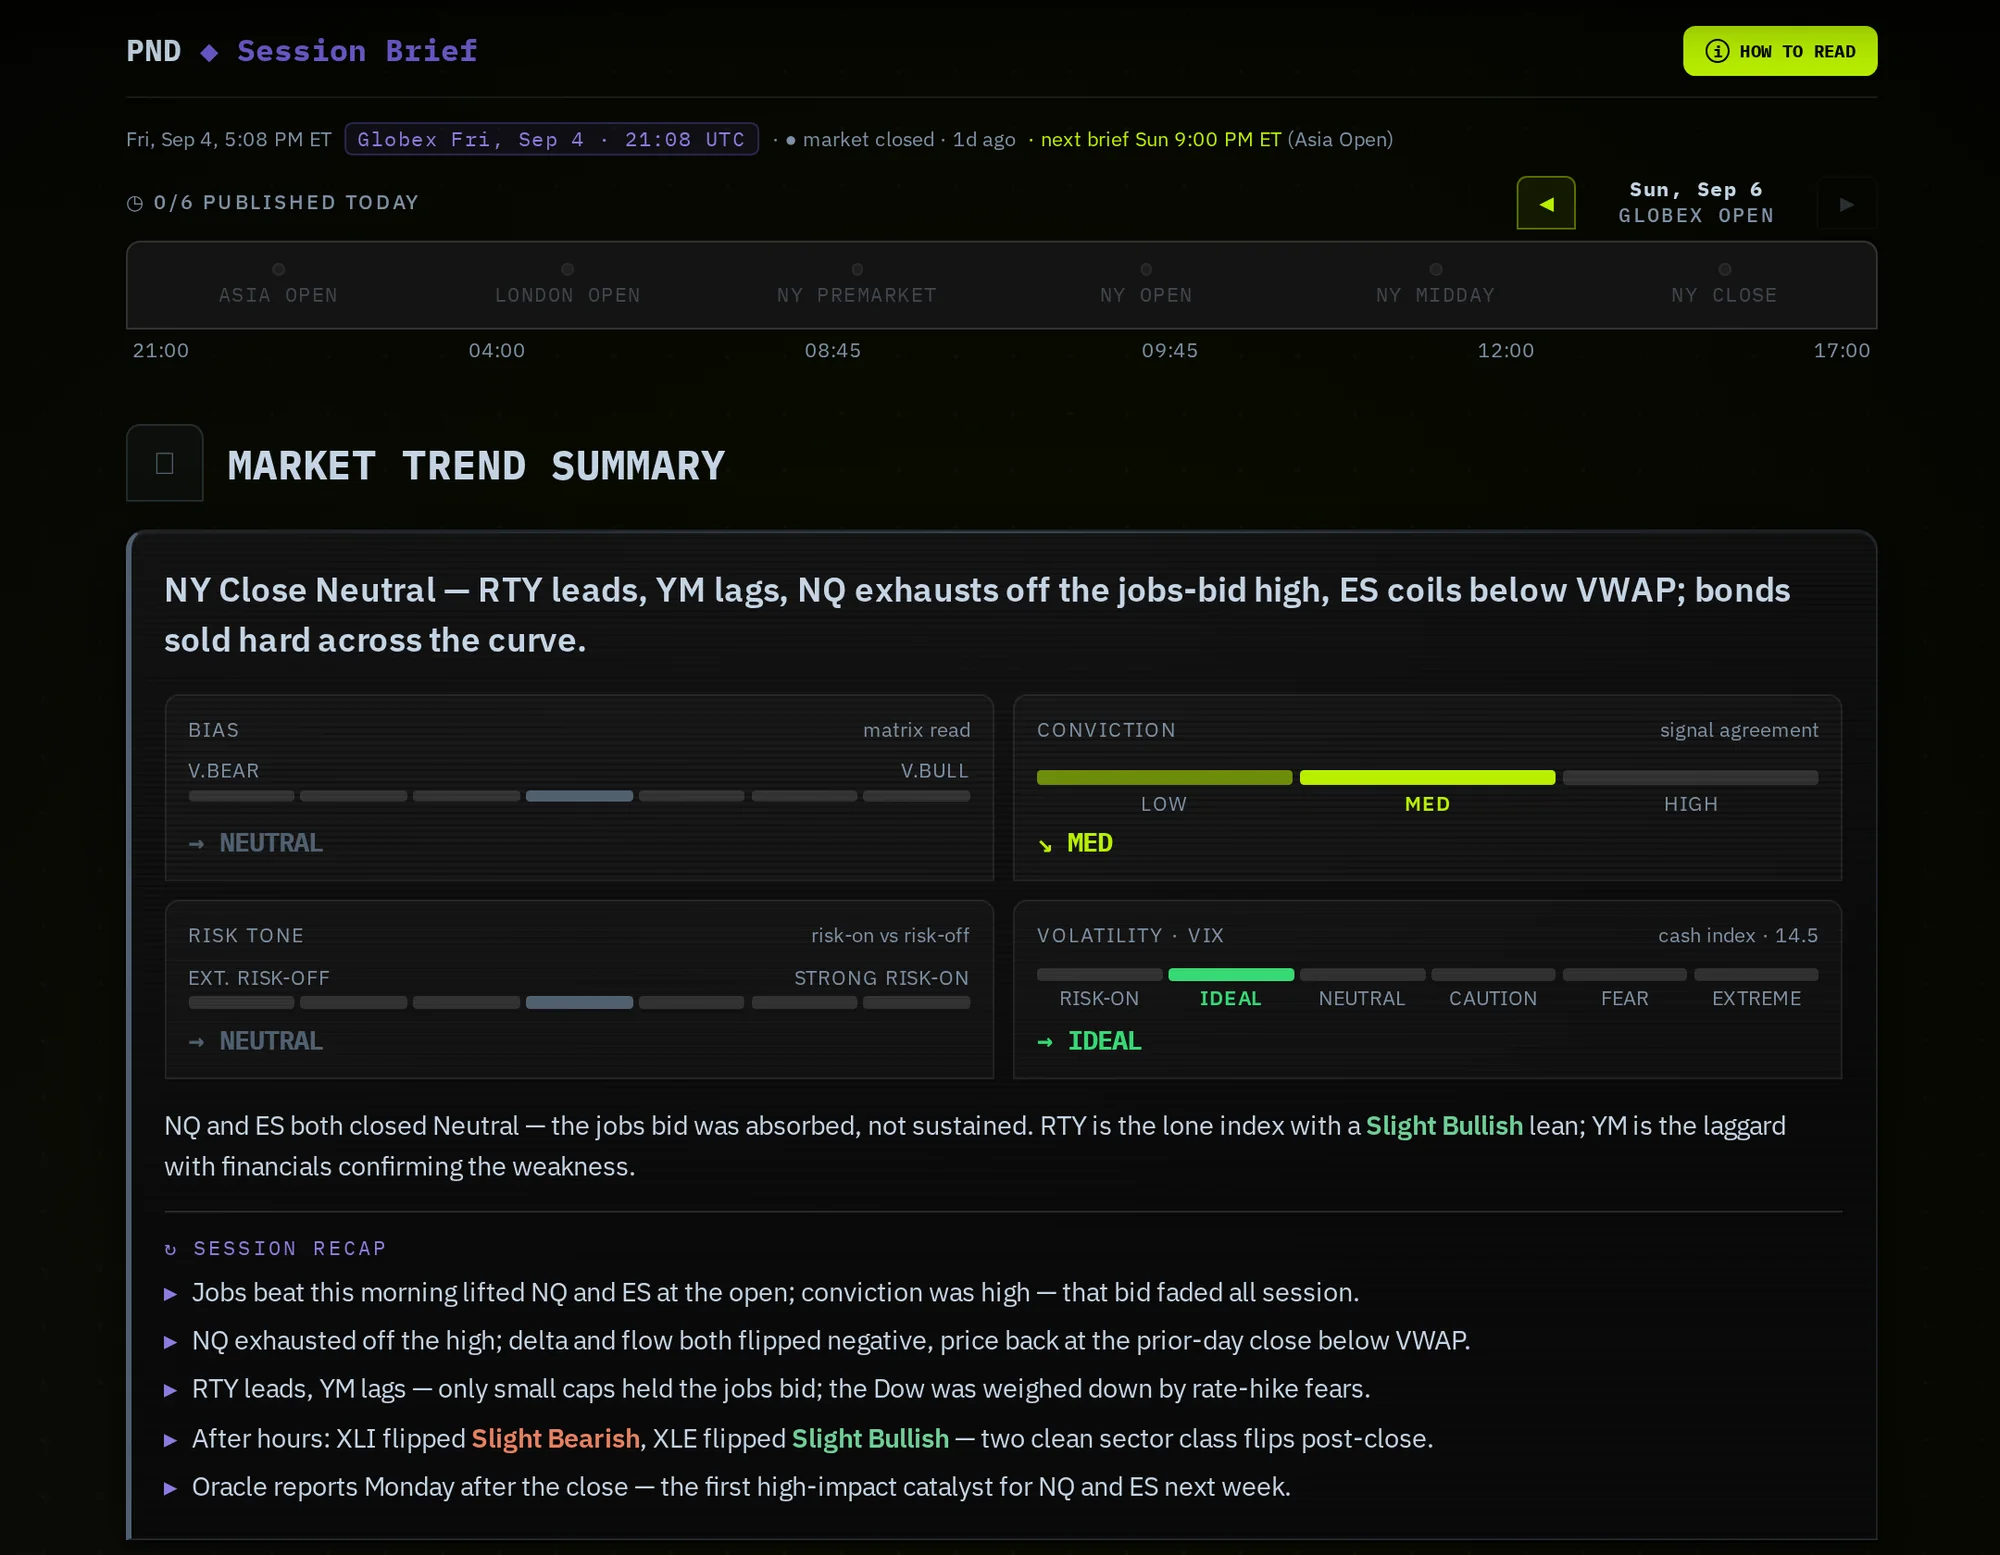
A market brief that is already written when you sit down.
Six editions a day on the CME session clock — Asia, London, NY pre-market, the open, midday and the close. Each one gives you the market trend, risk tone, conviction and volatility regime, a session recap, the calendar and news that matter, where the most aggressive buying and selling landed, and a read on your instruments with specific levels and two if-then paths. Past editions stay readable, so you can see what was said before a move.
- ✓6 editions a day, tied to the live CME calendar
- ✓Bias · conviction · risk tone · VIX regime
- ✓Calendar and headline reads with sentiment
- ✓Levels and Path A / Path B for your instruments
Trade Ideas
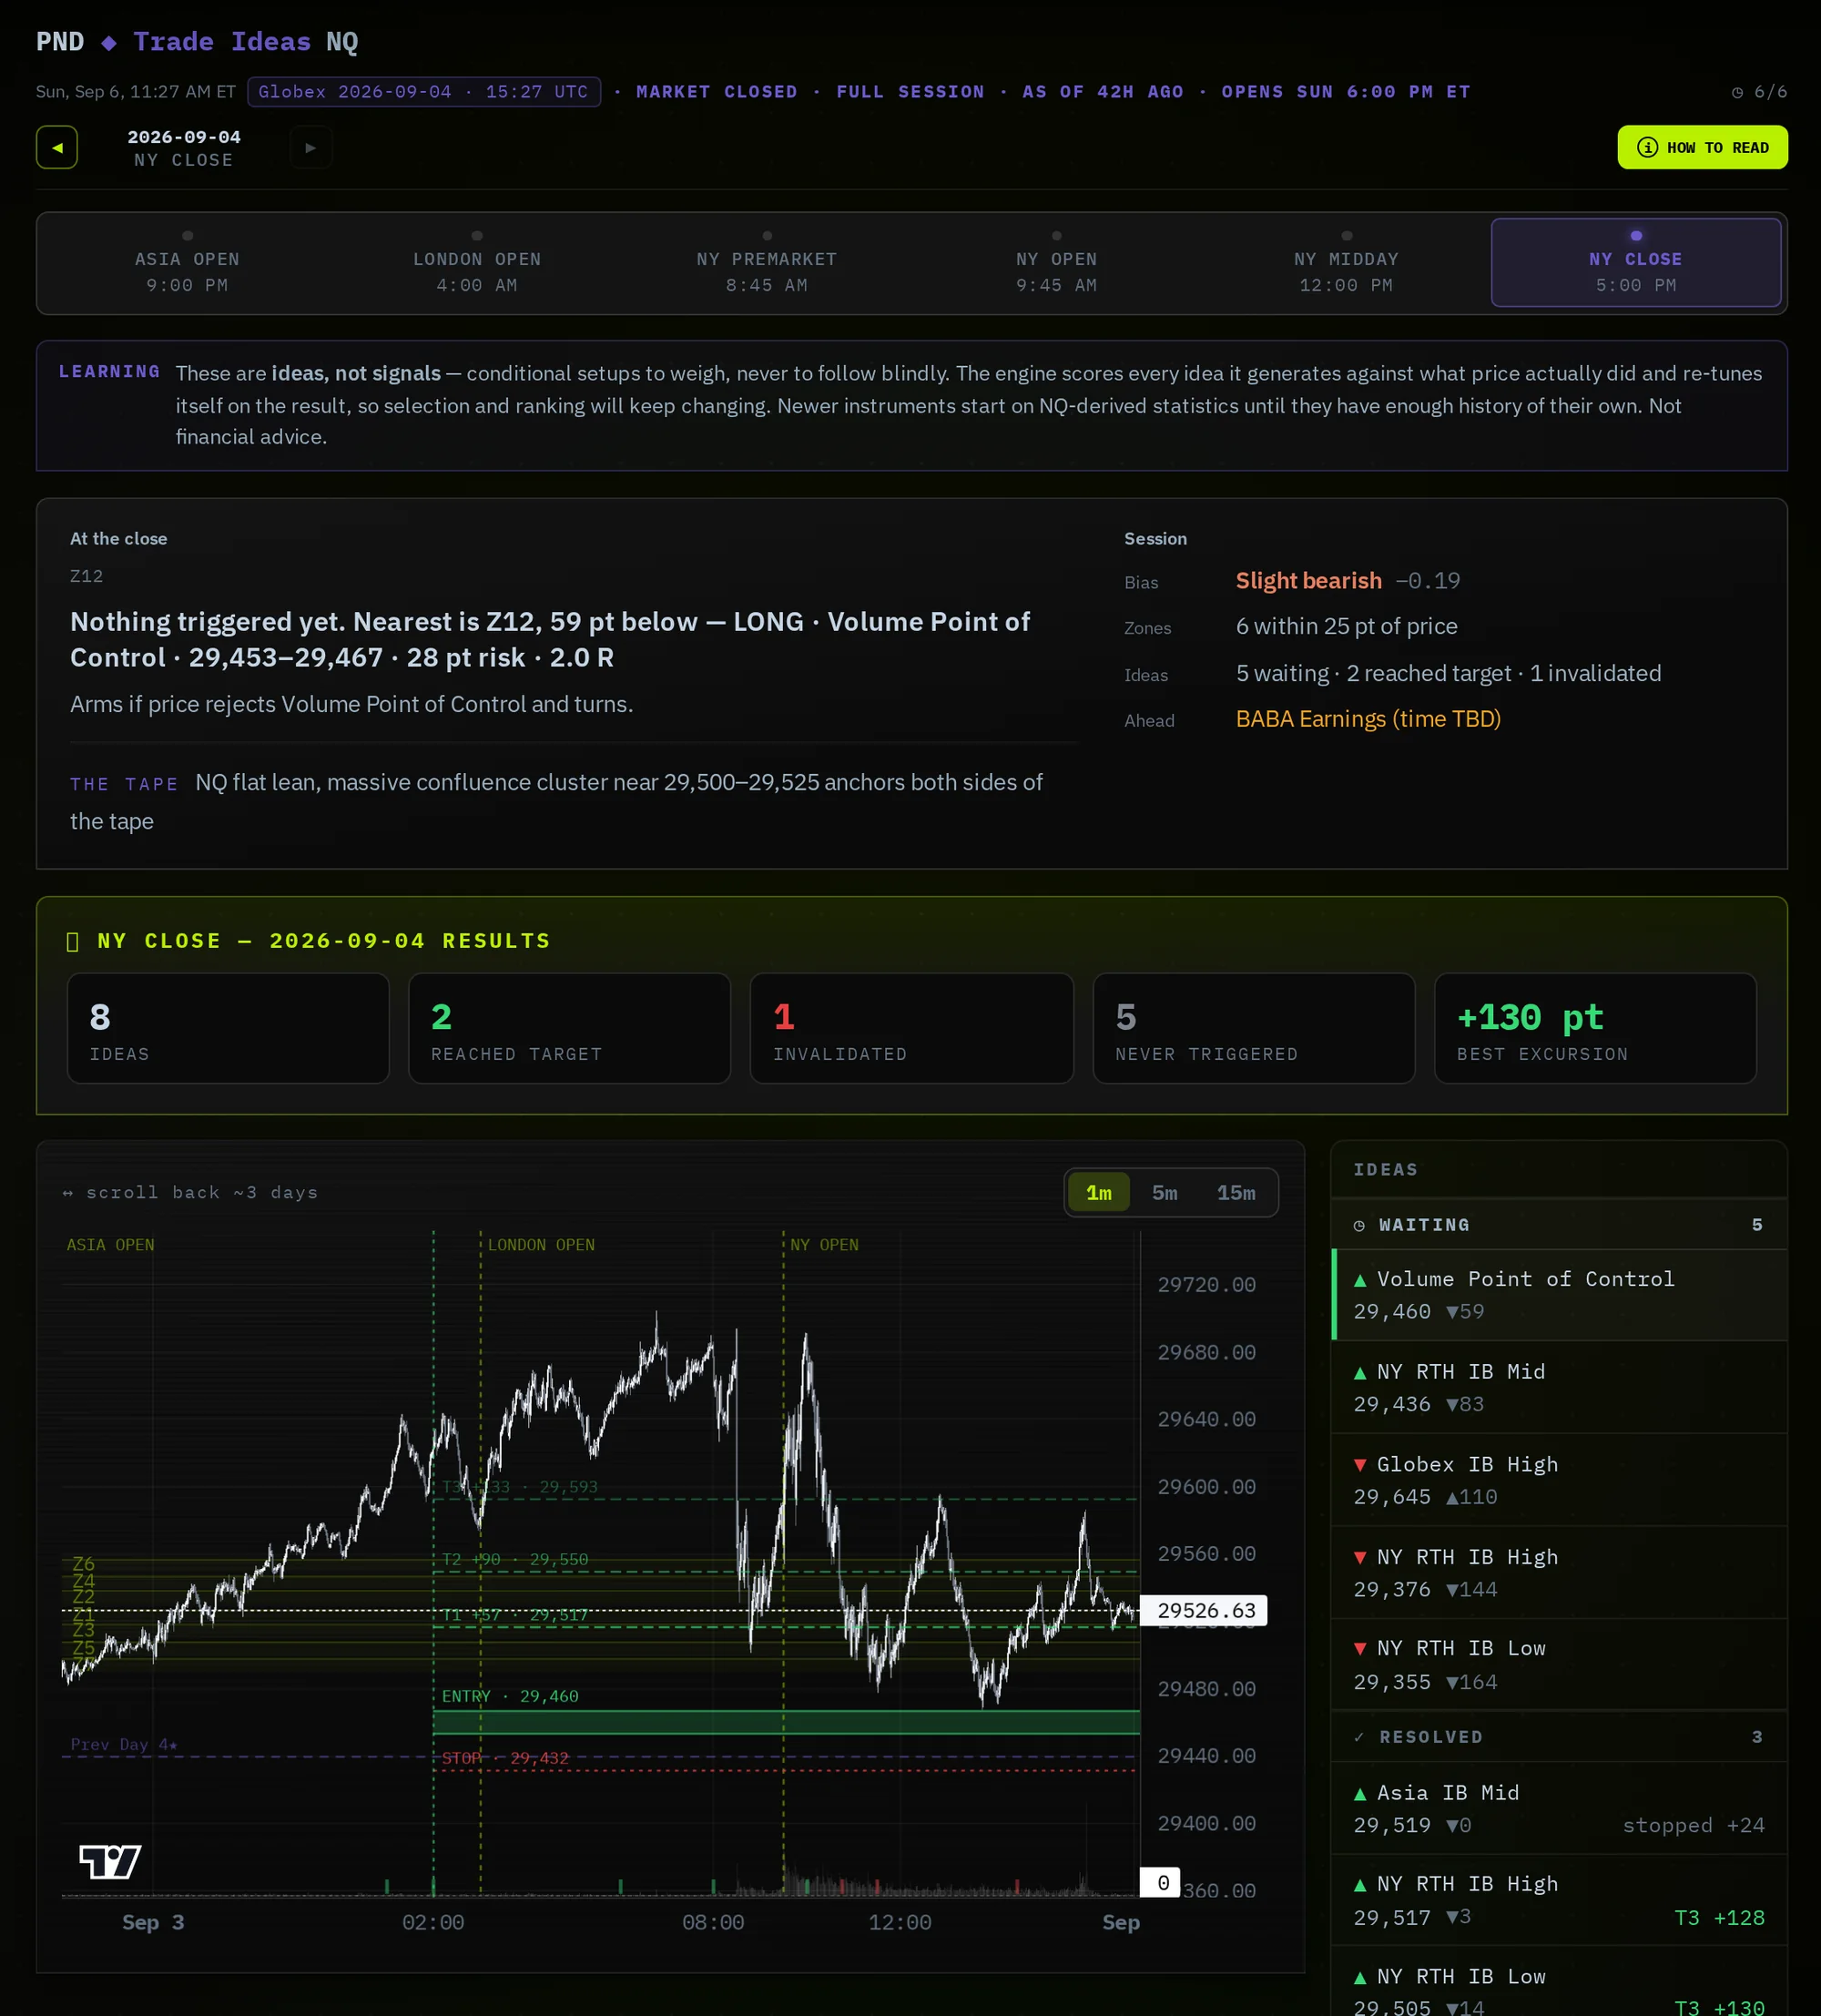
Conditional setups you can judge before you take them — and score after.
For NQ and ES, the desk finds where reference levels cluster into zones, then writes each idea the way a disciplined trader would: the trigger that arms it, targets in order, the risk in points, and the price that says it was wrong. Ideas draw as rays on the session chart. Every run is scored against what price actually did, and the results sit right above the ideas — reached target, invalidated, never triggered.
- ✓Trigger · targets · risk · invalidation on every card
- ✓Confluence zones ranked by level diversity
- ✓Results scorecard for every session
- ✓Ideas, not signals — context for your own decision
Delta Levels
The order flow behind the score, laid out by price and by trade size.
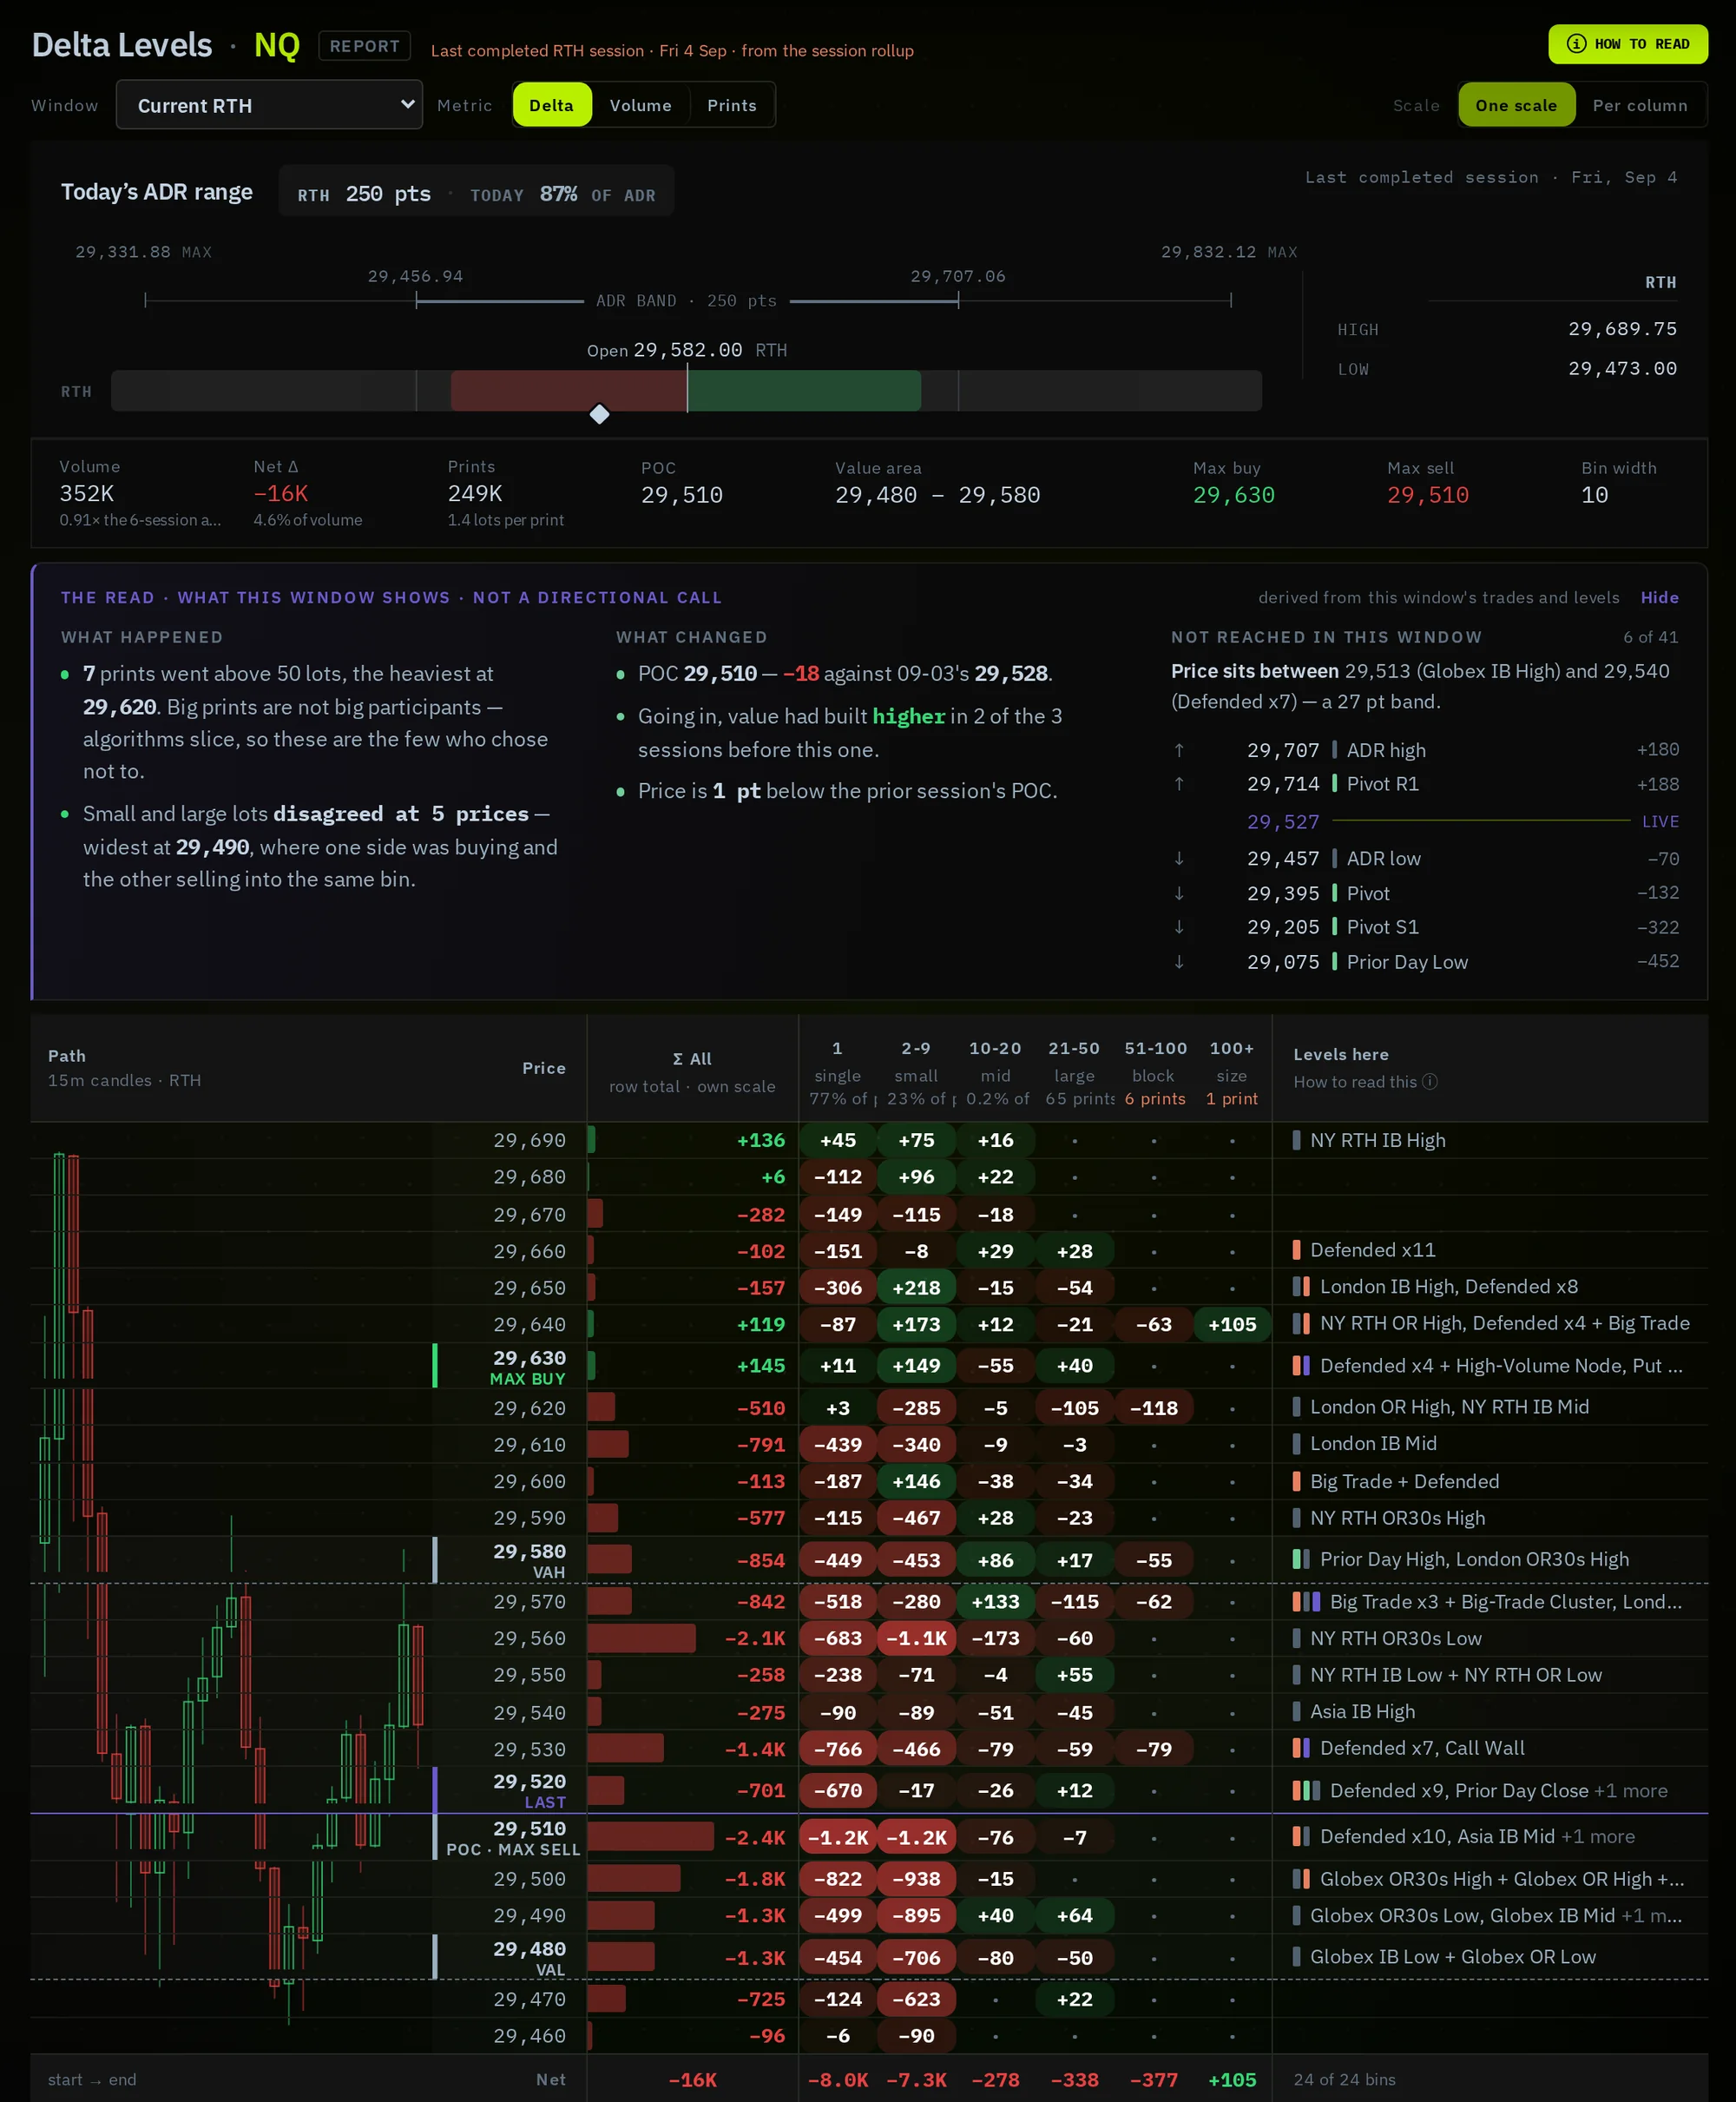
One market at a time, one window at a time — from the last 15 minutes to five sessions, RTH or full Globex. Price runs down the side, trade size across the top, so you can see where large lots and small lots disagreed, which prices absorbed the most aggression, and which levels size built at but price has not returned to. A written read tells you what happened, what changed versus the prior session, and what has not been reached.
- ✓Delta · volume · prints, by size bucket
- ✓Max buy, max sell, POC and value area
- ✓Reference levels labelled on every price
- ✓NQ · ES · GC today — more instruments coming
Two more surfaces are being built.
Both run on the same engine as the four above. They will appear here, with screenshots, as they ship.
Exposure Map
Where the options market is positioned — and what it does to price.
The desk already reads options flow as one part of the score. Exposure Map opens that up: a live map of where positioning is stacked above and below price, and where the levels sit that dealers have to defend or chase — for the same instruments you are already scoring.
- ◦Positioning above and below price
- ◦Levels that attract and levels that repel
- ◦Same instruments, same horizons as the board
Desk Analyst
A real-time AI agent that sits on top of The Bias Desk.
Ask it what the desk is seeing on NQ right now, why Delta is fighting Trend, or what the brief said before the open — and get an answer grounded in the same live numbers the board, the brief and the ideas already run on. Not a chatbot with opinions; the desk, answering in words.
- ◦Answers from the live board, brief and ideas
- ◦Ask across instruments, horizons and sessions
- ◦Plain-language, in futures points
Trend. Levels. Delta. Flow.Then five checks before it calls it.
Every instrument is scored on where price is moving against the areas that matter, who is in control, and whether the move is real — three independent dimensions, blended into one bias score. The blend adapts to the session, so the score means the same thing at 3 AM and 10 AM.
How price is moving against the areas that matter — key levels, session opens and closes, and the momentum stack on the horizon you're trading.
Who is in control right now — buyers lifting the offer or sellers hitting the bid — and whether the big prints agree with the small ones.
Whether the move is backed by real participation — value building, volume pace against a normal day, and how options traders are positioned.
T, D and F are read independently, then blended into one score from −100 to +100.The blend adapts to the session, so a score means the same thing at 3 AM as it does at 10 AM — and the five checks beside it say how much of the evidence agrees.
A Bearish read where Trend, Delta and Flow all confirm is a different animal from a Bearish read where they fight. So every score carries five checks: do T, D and F agree with the direction, is the move decisive, and has it been holding? The board ranks by how many pass. A check with no data to judge it leaves the count rather than failing it.
Seven classes.One score.
Every score maps to a named class with its own colour. The class gives you instant situational awareness; the score, from −100 to +100, gives you the precision.
Two instruments can both read Bullish — but one might score +38 and the other +71. The raw score is where the precision lives.
DAILY · INTRADAY · SCALP
One control re-ranks the whole board for the time horizon you trade. Every expanded row shows all three side by side, so you can see when the short-term read has separated from the bigger structure — that divergence is a signal, not noise.
- NQSlight Bullish+132/5
- ESNeutral+81/5
- YMSlight Bearish−202/5
- RTYSlight Bullish+283/5
- GCBearish−524/5
- SIBearish−383/5
- CLSlight Bullish+132/5
- BTCSlight Bearish−343/5
- ZFVery Bearish−805/5
- ZNBearish−654/5
- ZBBearish−454/5
Pre-market framing. Where the market has been leaning across recent sessions, before the open. Here the Treasury curve leads — ZF very bearish with all five checks agreeing — while NQ is barely leaning at +13.
One control re-ranks the whole board. Every expanded row shows all three horizons side by side, so you can see when the short-term read has separated from the bigger structure — that divergence is a signal, not noise. Try the horizons above.
Eleven futures on the board.Thirty-four instruments behind it.
Full scoring, AI read, live price and % of ADR for eleven futures on the board. Beneath them, four market groups and VIX give every read its context — which groups agree, which are rotating, and whether the macro backdrop backs the call.
The index complex. When the indices pull apart, the board says which member is leading and which is lagging.
Which parts of the market are receiving or shedding capital. Rotation against the index is often the first warning.
Dollar, rates, volatility, crypto and commodities — the backdrop that sets risk-on or risk-off, read as a source, not a peer.
The names that drive NQ disproportionately. When they diverge from the index, the index usually follows.
Every group is scored in its own right, then feeds the instrument you are actually trading. A read on NQ arrives with the whole tape behind it — which groups agree, which are rotating, and whether the macro backdrop backs the call.
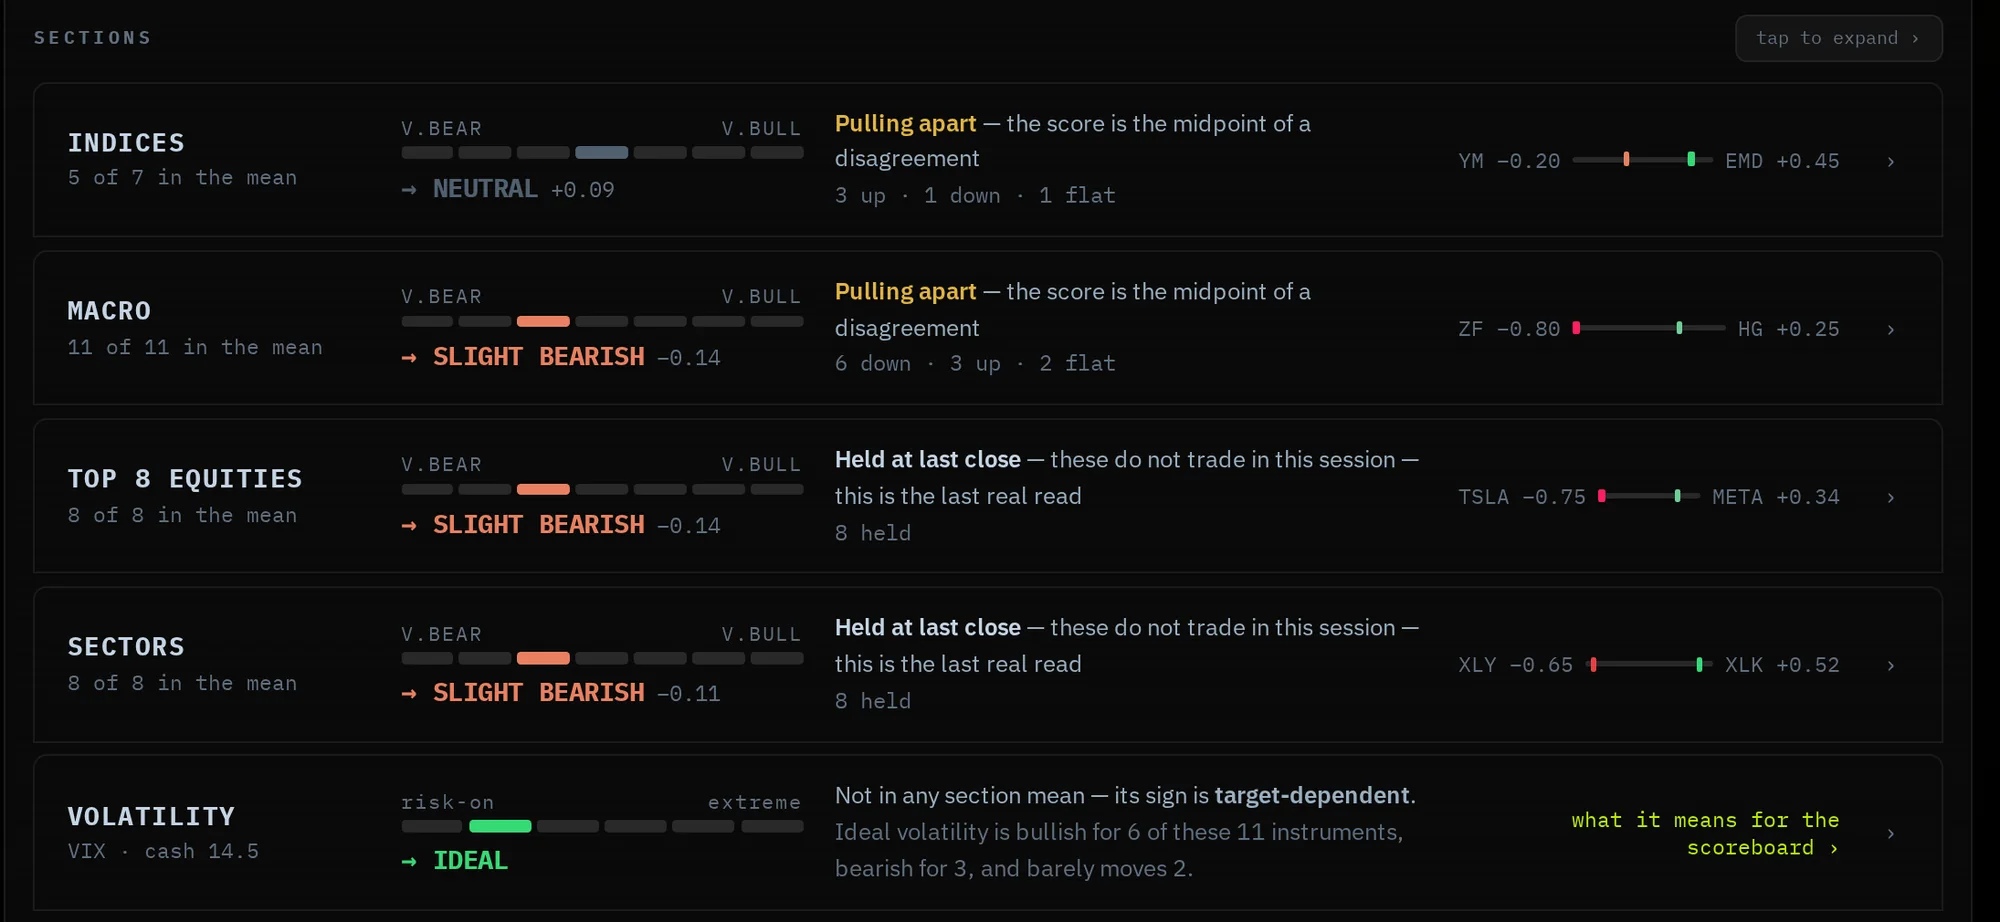
Each group reports its own bias, how it is moving — all bid, all heavy, rotating, no leadership — and how uniformly its members agree. Open a group to see every member placed against the group mean: driving the move, along for the ride, or pulling against it. VIX sits apart, read for what it means for each instrument.
Made to stay openfrom Globex to the NY close.
A written read for each instrument at each horizon — what is driving the bias, price against key levels in points, and where the read would change.
Scrub back through the last seven days and see exactly what the desk was saying at any moment — for post-session review and studying setups.
Filter the board to what you trade. Built-in groups for All, NQ/ES, equity indices, metals and bonds, or save your own.
Every surface has a one-tap guide that explains each element on screen under the name the screen uses — plus the product tour.
Reads and briefs follow the live CME calendar. Weekends, holidays and the nightly halt hold the last real read instead of scoring noise.
The full desk on a wide screen; the scoreboard, brief, ideas and levels as tabs on your phone. Install it to your home screen.
Two themes — a dark trading-room look, or a paper-light one for daylight and screenshots.
Options positioning mapped to price, and a real-time AI agent that answers from the live desk. See In the works, above.
Built for futures day traders.Not for everyone.
"The Bias Desk is market context. What you do with that context is your edge — not ours."
See The Bias Desk in Action
The full product on real market data — every surface, every horizon, every row. No login.
- ✓Bias Scoreboard — 11 futures ranked live
- ✓DAILY · INTRADAY · SCALP horizons
- ✓T · D · F breakdown and AI Read on every row
- ✓Session Brief — 6 editions a day
- ✓Trade Ideas — NQ and ES, scored every session
- ✓Delta Levels — order flow by price and size
- ✓7-day Time Replay
- ✓Desktop and mobile
Know what the futures marketis doing before you do anything.
Eleven futures ranked. Thirty-four instruments behind them. The brief written, the ideas drafted, the order flow and options flow laid bare — all session long.