What is The Bias Desk?§
The Bias Desk is a live market-context desk for futures day traders. It answers one question before you trade — which way is the market leaning, how sure is it, and what's the plan if it turns? — and keeps answering it all session long.
It does that on four surfaces that all read from the same engine:
| Surface | What it gives you |
|---|---|
| Bias Scoreboard | Eleven futures ranked by how clearly each is leaning, with the score, the checks behind it, history, % of ADR and live price. Open a row for the chart, the breakdown and an AI read. |
| Session Brief | A written market brief, six editions a day on the CME session clock — trend, risk tone, conviction, recap, calendar and news, and a read on your instruments with levels and two paths. |
| Trade Ideas | Conditional setups for NQ and ES, each with its trigger, targets, risk and invalidation stated up front, drawn on the chart, and scored against what price actually did. |
| Delta Levels | The order flow underneath the score — net aggression by price and by trade size, with the key levels labelled and a written read of what happened. |
The whole desk runs on live data at bias.profitnotiondaily.com/demo — no login required. Membership is currently by waitlist.
Getting Around§
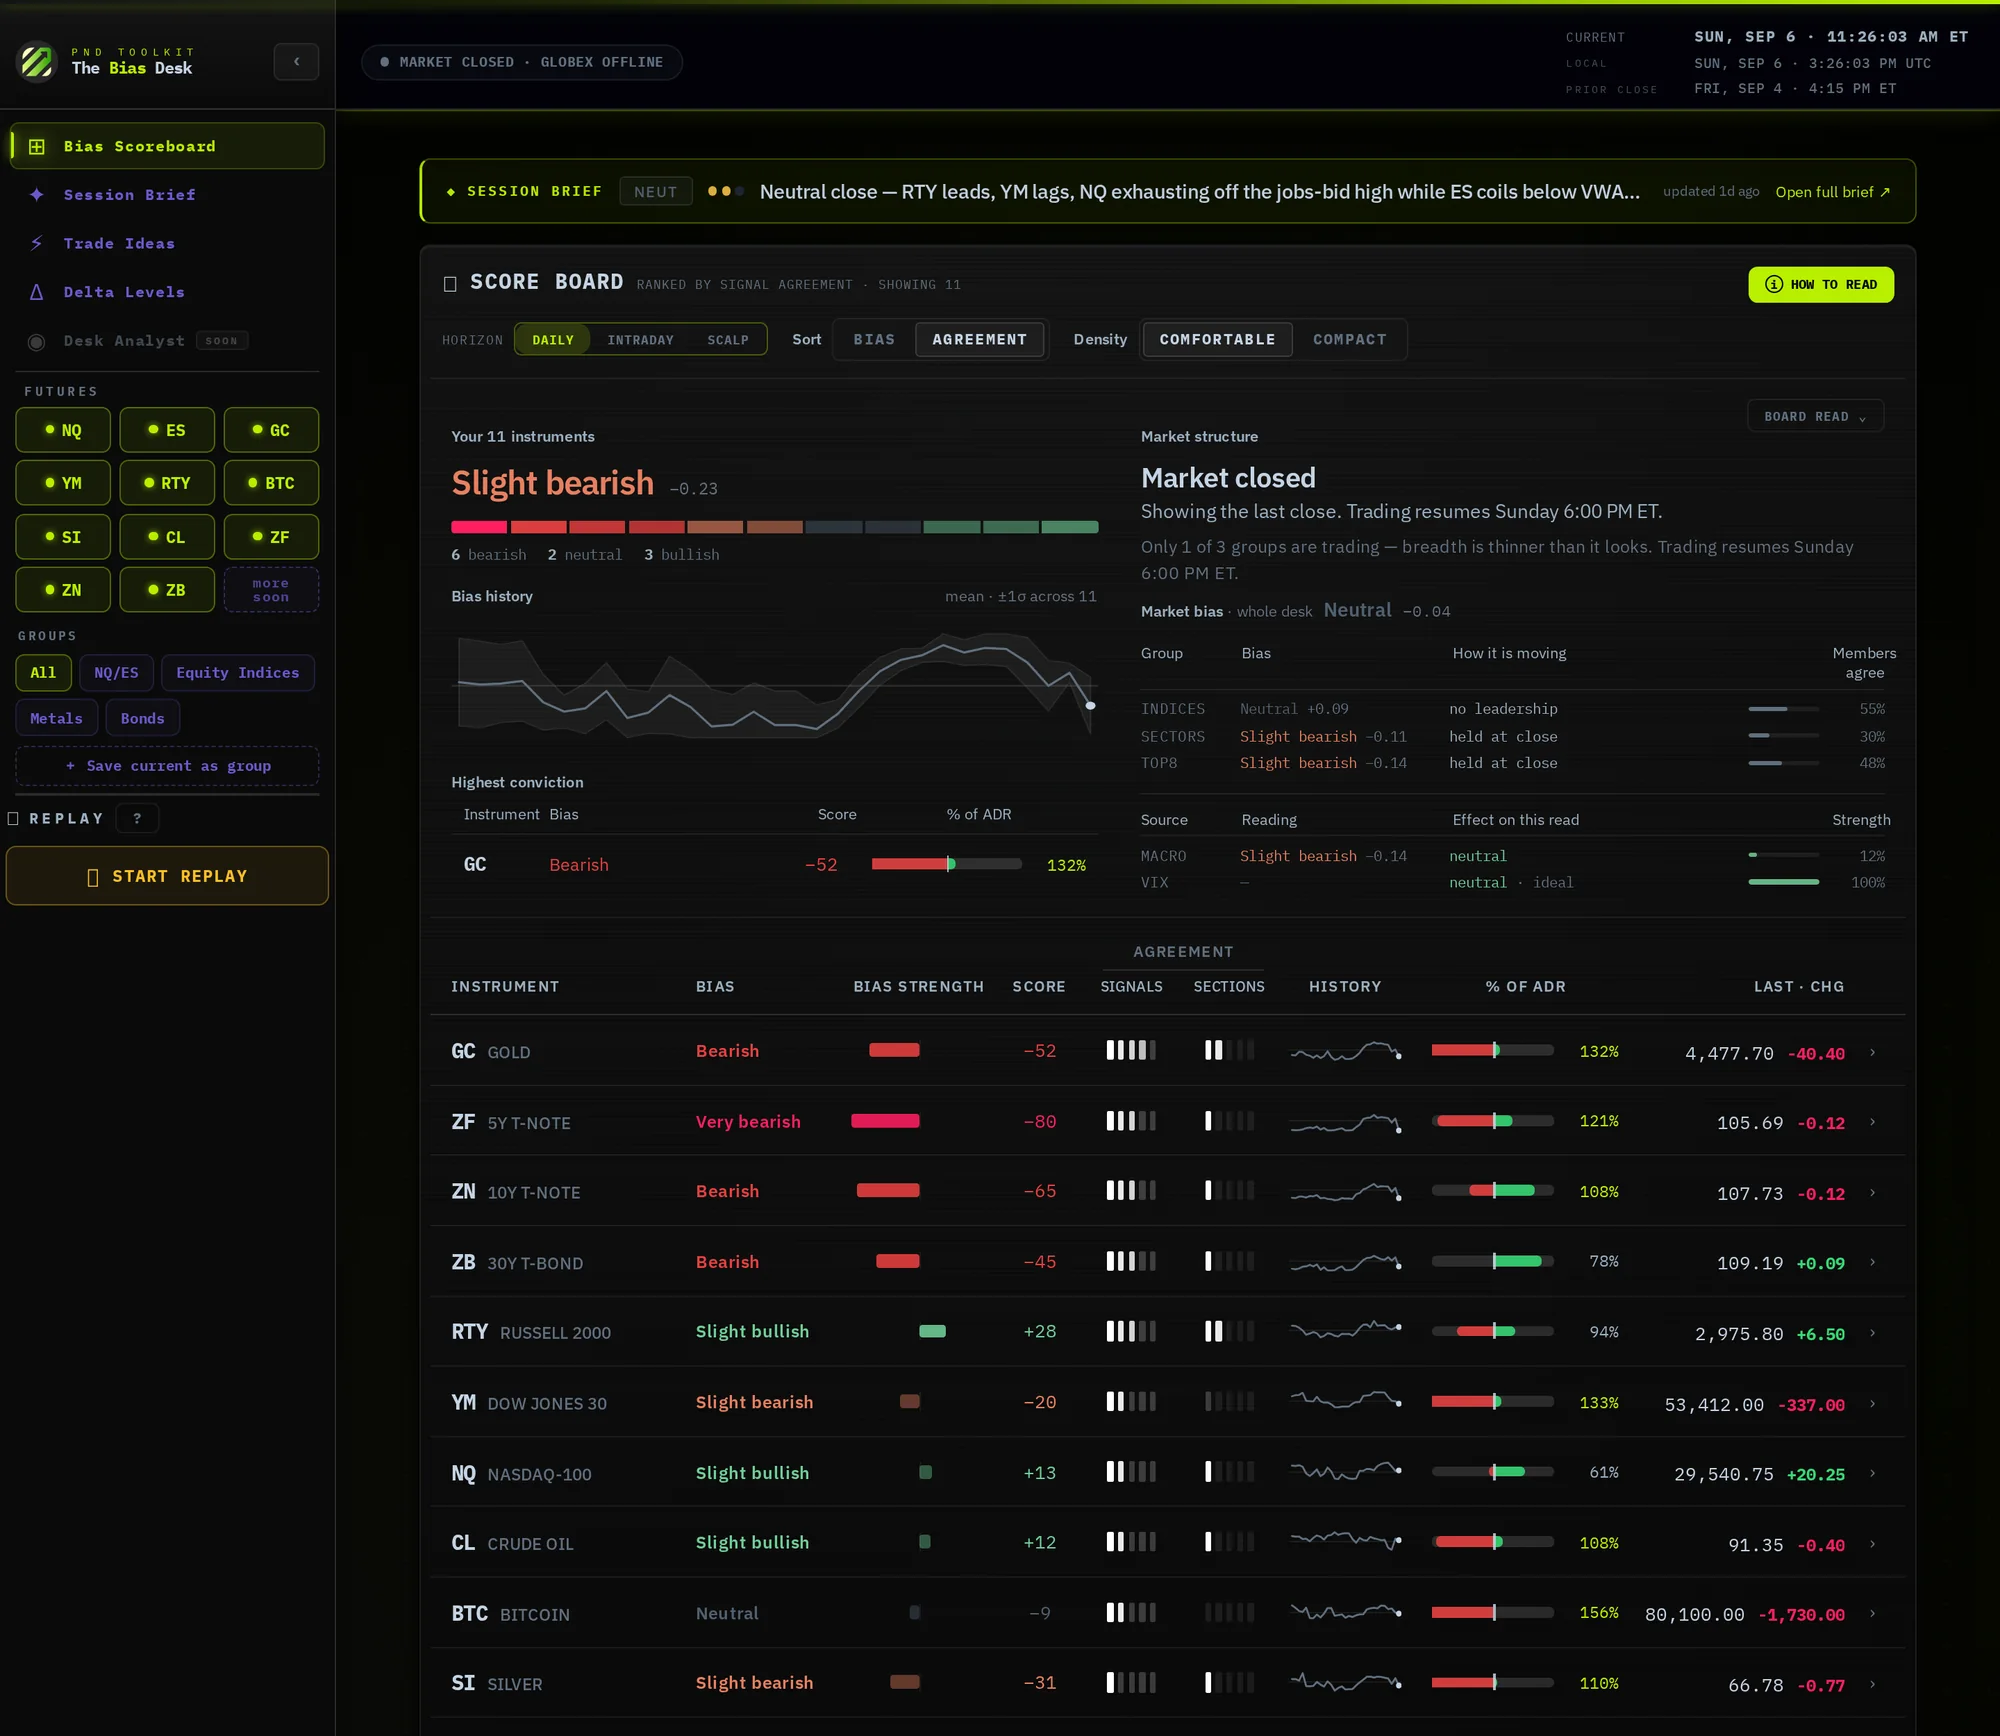
The sidebar
Surfaces — Bias Scoreboard, Session Brief, Trade Ideas and Delta Levels. One is showing at a time. Exposure Map and Desk Analyst are on the way (section 15).
Futures — the eleven instruments on the board. Click to toggle any instrument in or out of your selection; double-click one to show only that instrument. On Trade Ideas and Delta Levels, the same pills pick the single symbol that surface is showing.
Groups — built-in selections for All, NQ/ES, Equity Indices, Metals and Bonds. Save current as group keeps any selection you build as a chip of your own.
Replay — scrub the desk back to any moment in the last seven days (see section 12). Settings — theme, documentation, billing, Discord.
The header
The session chip on the left tells you which trading session the desk is in — Asia, London, pre-market, NY open, RTH, after-hours — or that the market is closed. The clocks on the right show current ET, your local time, and when the prior close was.
How to read, and the tour
Every surface has a How to read button. It opens a guide to that exact screen — one entry per thing on it, under the name the screen uses — and a Product tour tab with the walkthrough video. If you learn the layout on one surface you already know it on the others.
Bias Scoreboard§
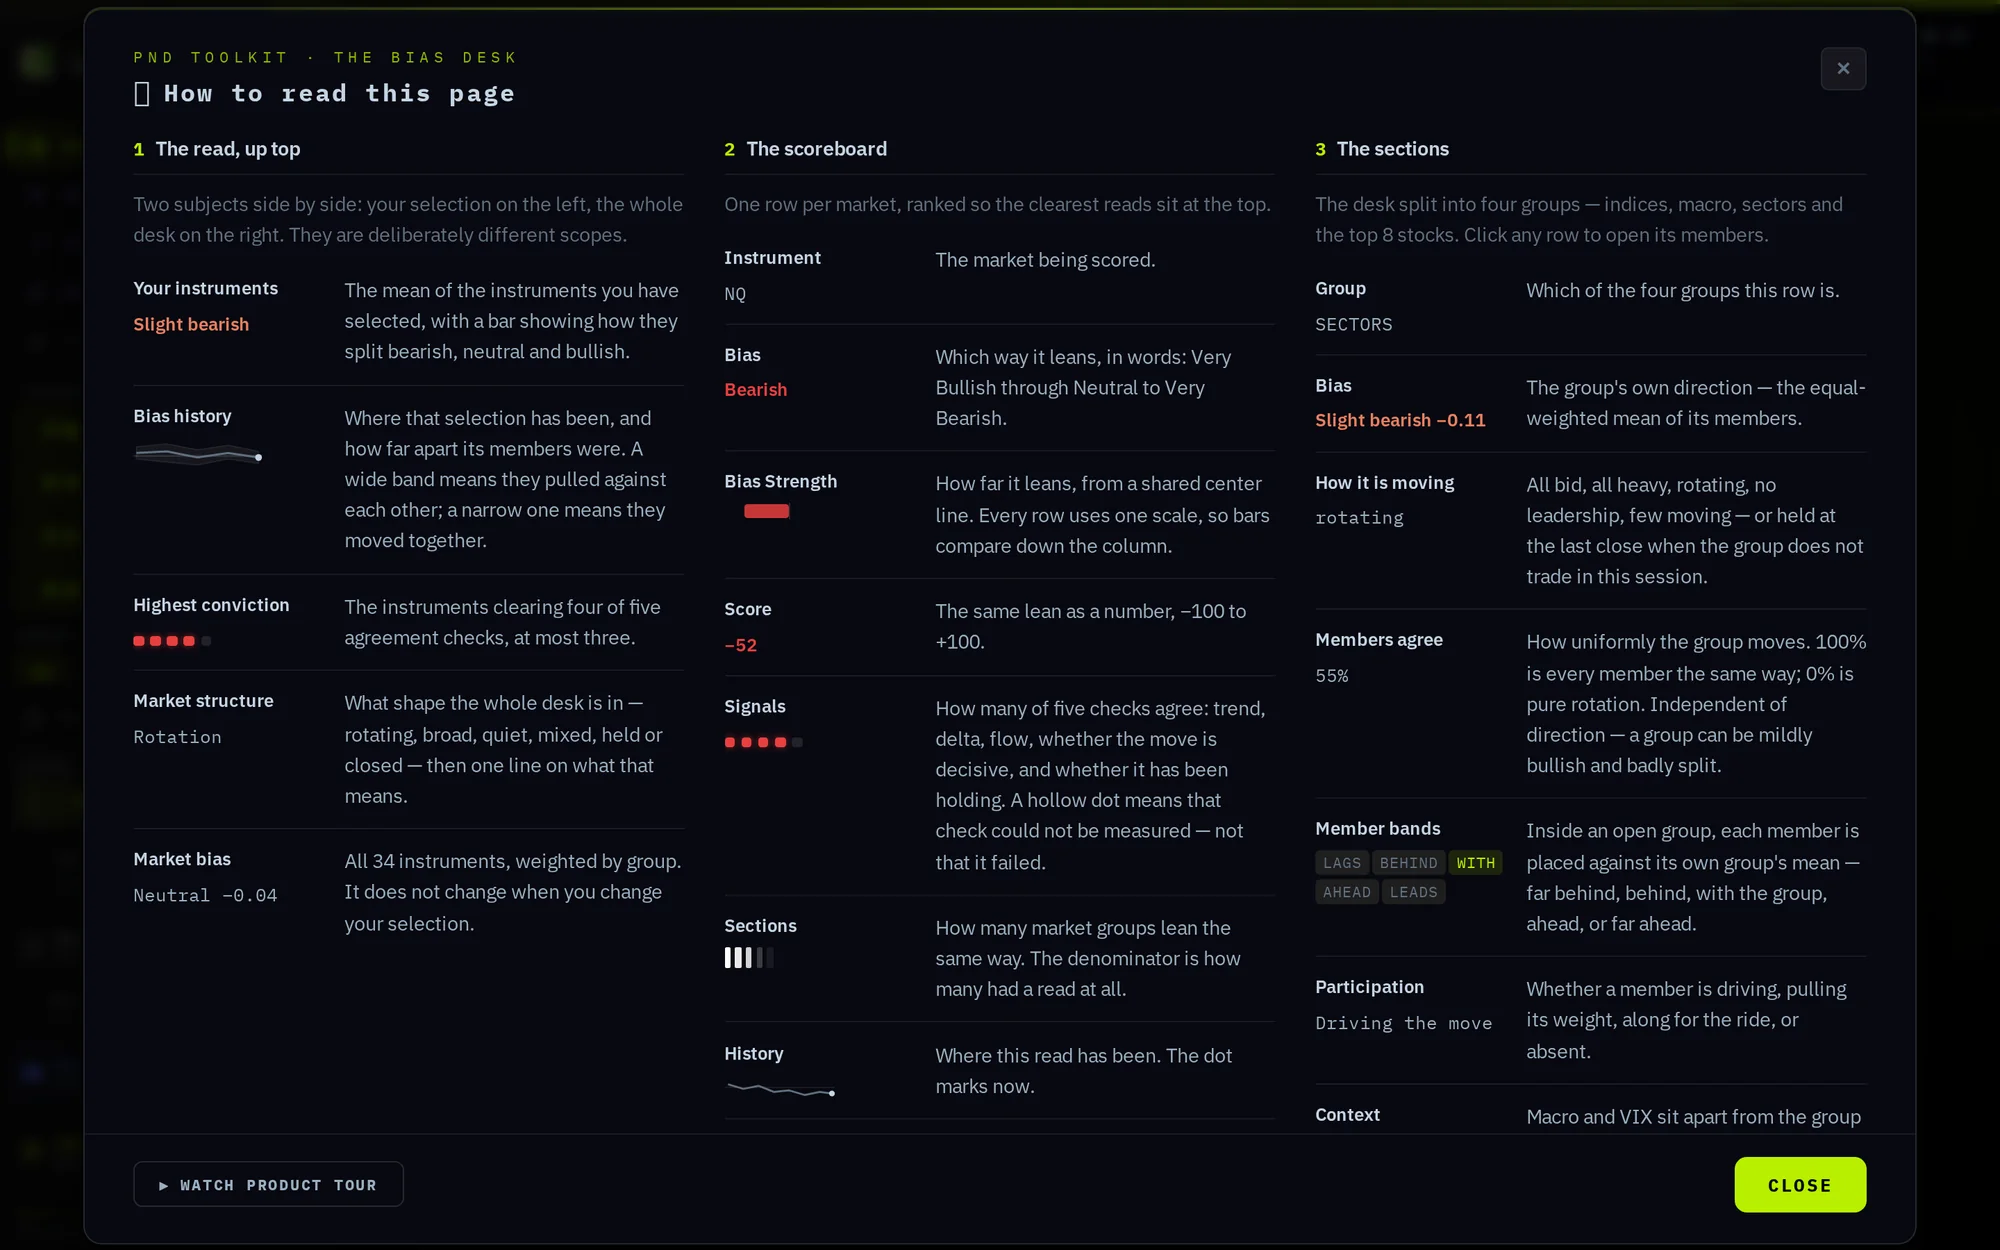
The board has three parts, top to bottom: the read up top, the scoreboard itself, and the market groups beneath it (section 07).
The read, up top
Two subjects side by side, deliberately different in scope — your selection on the left and the whole desk on the right.
| Element | What it means |
|---|---|
| Your instruments | The mean bias of the instruments you have selected, with a bar showing how they split bearish, neutral and bullish. |
| Bias history | Where that selection has been, and how far apart its members were. A wide band means they pulled against each other; a narrow one means they moved together. |
| Highest conviction | The instruments clearing four of five agreement checks right now, at most three. |
| Market structure | What shape the whole desk is in — rotating, broad, quiet, mixed, held or closed — then one line on what that means. The Board read button expands it. |
| Market bias | All 34 instruments, weighted by group. It does not change when you change your selection. |
The board
One row per market, ranked so the clearest reads sit at the top. The controls above it: Horizon (Daily · Intraday · Scalp), Sort (by Bias or by Agreement), and Density (Comfortable or Compact).
| Column | What it means |
|---|---|
| Bias | Which way it leans, in words — Very Bullish through Neutral to Very Bearish. |
| Bias strength | How far it leans, from a shared centre line. Every row uses one scale, so the bars compare down the column. |
| Score | The same lean as a number, −100 to +100. |
| Signals | How many of five checks agree — trend, delta, flow, whether the move is decisive, and whether it has been holding. A hollow dot means that check could not be measured, not that it failed. |
| Sections | How many market groups lean the same way. The denominator is how many had a read at all. |
| History | Where this read has been. The dot marks now. |
| % of ADR | How much of a normal day's range it has travelled from the session open — left is how far it fell, right how far it rose. Over 100% means more than a typical day. |
| Last · Chg | Latest price, then points moved since the previous close. |
An expanded row
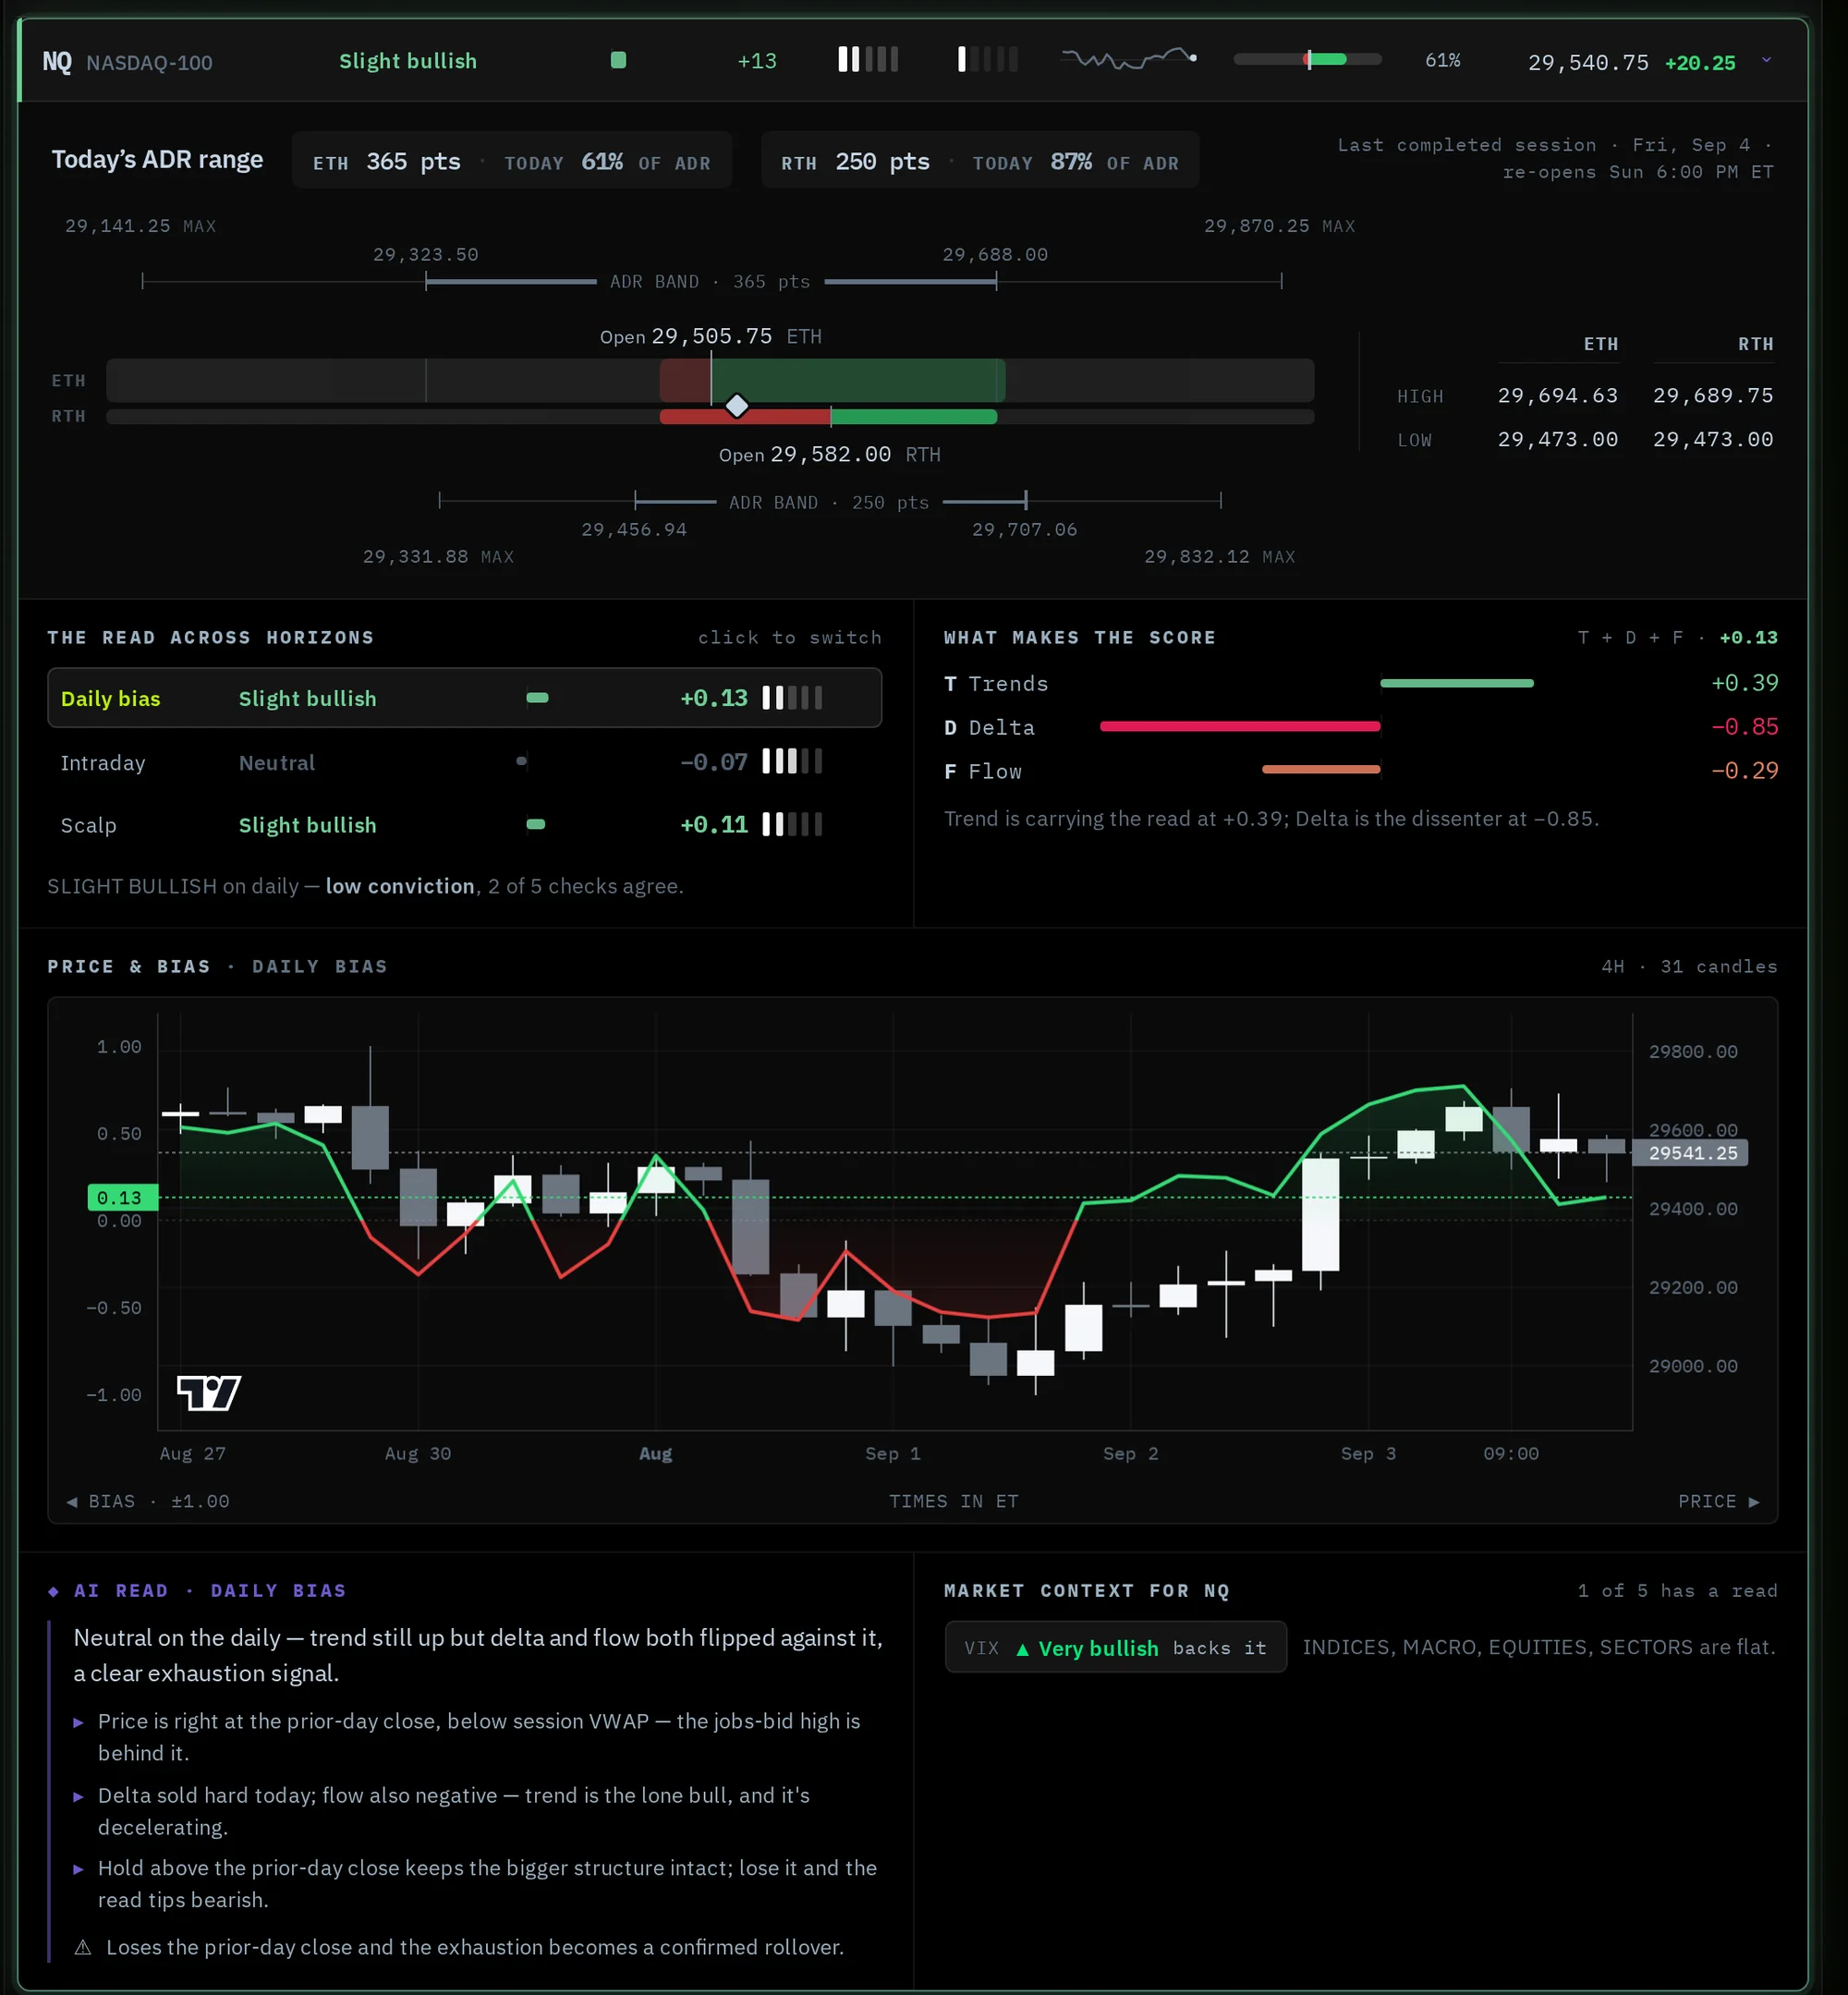
Click any row (or its ›) to open it.
| Panel | What it means |
|---|---|
| Today's ADR range | Where price has travelled today against a normal day's range, for the full Globex session (ETH) and the cash session (RTH) separately — with the open, the high and low, and the max reach a typical day would allow. |
| The read across horizons | Daily, Intraday and Scalp side by side, each with its class, score and agreement checks. Click one to switch the chart and AI read to that horizon. The line beneath states the conviction in words. |
| What makes the score | The three dimensions — T Trends, D Delta, F Flow — with a bar and value each, and one sentence on which is carrying the read and which is dissenting. |
| Price & bias | Candles for the horizon's timeframe with the bias line overlaid, so you can see the score against the price action that produced it. |
| AI read | A written read for this instrument at this horizon: the headline, what's driving it, price against key levels in points, and where the read would change. Marked with ◆ wherever it appears. |
| Market context | Whether the wider desk backs the read — which groups agree, and what VIX means for this instrument specifically. |
Bias Classes & Signal Agreement§
Every score maps to one of seven named classes. Use the class for instant awareness and the score for precision — two instruments can both be Bullish at +38 and +71.
Signal agreement — the ranking key
The class tells you the direction. Agreement tells you how much to trust it. A Bearish instrument whose trend, delta and flow all confirm reads very differently from a Bearish one whose parts disagree — so every score carries five checks, shown as five dots on the board:
| Check | Passes when |
|---|---|
| T | Trend agrees with the direction of the score. |
| D | Delta agrees. |
| F | Flow agrees. |
| MAG | The move is decisive — a full Bullish / Bearish, not a Slight. |
| HOLD | The score has kept its direction across the recent window. |
A check with no data to judge it is dropped from the count rather than failed — so 3 of 4 and 4 of 5 are the same read. The same five checks drive the board's ranking, the conviction word in an expanded row, and the conviction meter in the Session Brief, so the surfaces never disagree about one instrument.
Horizons — Daily · Intraday · Scalp§
The Horizon control re-ranks the whole board for the time frame you trade. There is one engine; each horizon asks it a different question, on a different window, and gets a different answer. Every expanded row shows all three side by side.
| Horizon | The question it answers | Use it for |
|---|---|---|
| DAILY | Where has the market been leaning across recent sessions? | Pre-market framing. Whether you are looking for longs, shorts, or staying flat today. |
| INTRADAY | What character is today's session developing? | The working view during market hours. Every entry is either with or against it. |
| SCALP | What has aggression been doing in the last hour and a half? | Momentum and fade decisions inside the session bias. Expect it to change faster — that's the point. |
When the market is closed, all three horizons hold the last real read from the close rather than scoring the wind-down. They begin diverging again as soon as Globex re-opens.
T · D · F — What Makes the Score§
Every instrument is scored on three independent dimensions, each on its own scale, then blended into one bias score. The blend adapts to the session: overnight, structure carries more weight; in the cash session, order flow and participation carry as much as trend.
| Dimension | What it measures | Read it as |
|---|---|---|
| T — Trends Price vs key levels | Where price sits against the structure that matters — reference levels, session opens and closes, and the momentum stack on the horizon's timeframe. | Is price positioned above or below the levels that count? |
| D — Delta Aggressor order flow | Who is in control — buyers lifting the offer or sellers hitting the bid — and whether the big prints agree with the small ones, over the horizon's window. | Who is doing the work right now? |
| F — Flow Volume, value & options | Whether the move is backed by participation — value building, volume pace against a normal day, and how options traders are positioned. | Is this real, and is anyone leaning the same way? |
The What makes the score panel in every expanded row shows all three with a one-line verdict — which dimension is carrying the read and which is dissenting. When all three agree the read is high-conviction. When Delta fights Trend, turns often start there.
Market Groups & VIX§
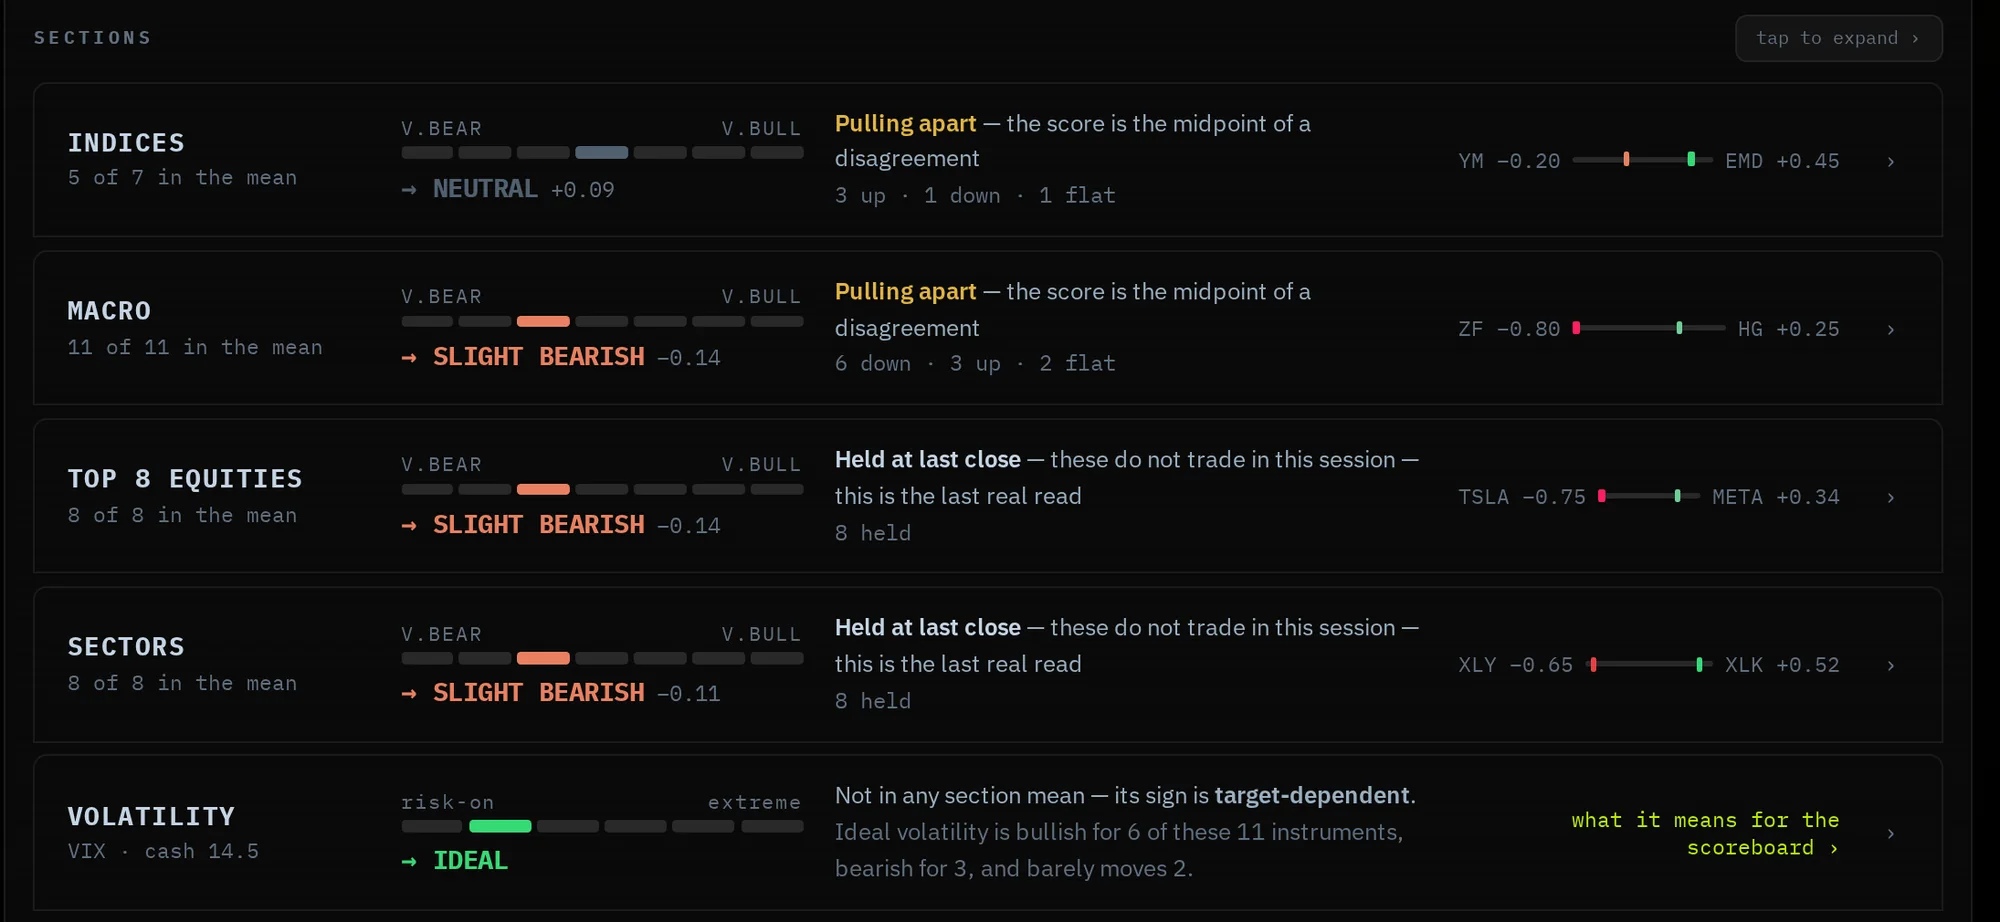
Beneath the board, the 34 instruments the desk scores are split into four groups, plus VIX. This is the context every read is grounded in — which groups agree with your instrument, which are rotating, and whether the macro backdrop backs the call.
| Group | Members |
|---|---|
| Indices | NQ · ES · GC · YM · RTY · EMD · NKD · EU |
| Macro | USD · ZN · ZF · ZB · VIX · BTC · CL · SI · HG · 6J |
| Top 8 Equities | NVDA · AAPL · MSFT · AVGO · AMZN · TSLA · META · GOOG |
| Sectors | XLK · XLF · XLY · XLE · XLV · XLI · XLP · XLU |
Reading a group row
| Element | What it means |
|---|---|
| Bias | The group's own direction — the equal-weighted mean of its members. The count beside the name says how many members are in the mean right now. |
| How it is moving | All bid, all heavy, rotating, no leadership, few moving — or held at close when the group does not trade in this session (equities and sectors overnight). |
| Members agree | How uniformly the group moves. 100% is every member the same way; 0% is pure rotation. Independent of direction — a group can be mildly bullish and badly split. |
| Leader · laggard | The member furthest ahead of the group and the one furthest behind, with their scores. |
Open a group to see every member placed against the group mean — far behind, behind, with the group, ahead, far ahead — and whether each is driving the move, pulling its weight, along for the ride, or absent.
Macro and VIX are context, not peers
Macro and VIX sit apart from the group table. Neither is a peer group for an index future; both answer whether the wider backdrop backs the read. VIX in particular is target-dependent — the same volatility regime is bullish for some instruments on the board and bearish for others, and the desk says which.
Session Brief§
The brief is the desk's read, written. It is generated once per session from the same numbers the board shows, stored, and served — not re-written each time you open it. A one-line summary of the current edition sits above the scoreboard at all times; Open full brief or the sidebar takes you to the whole thing.
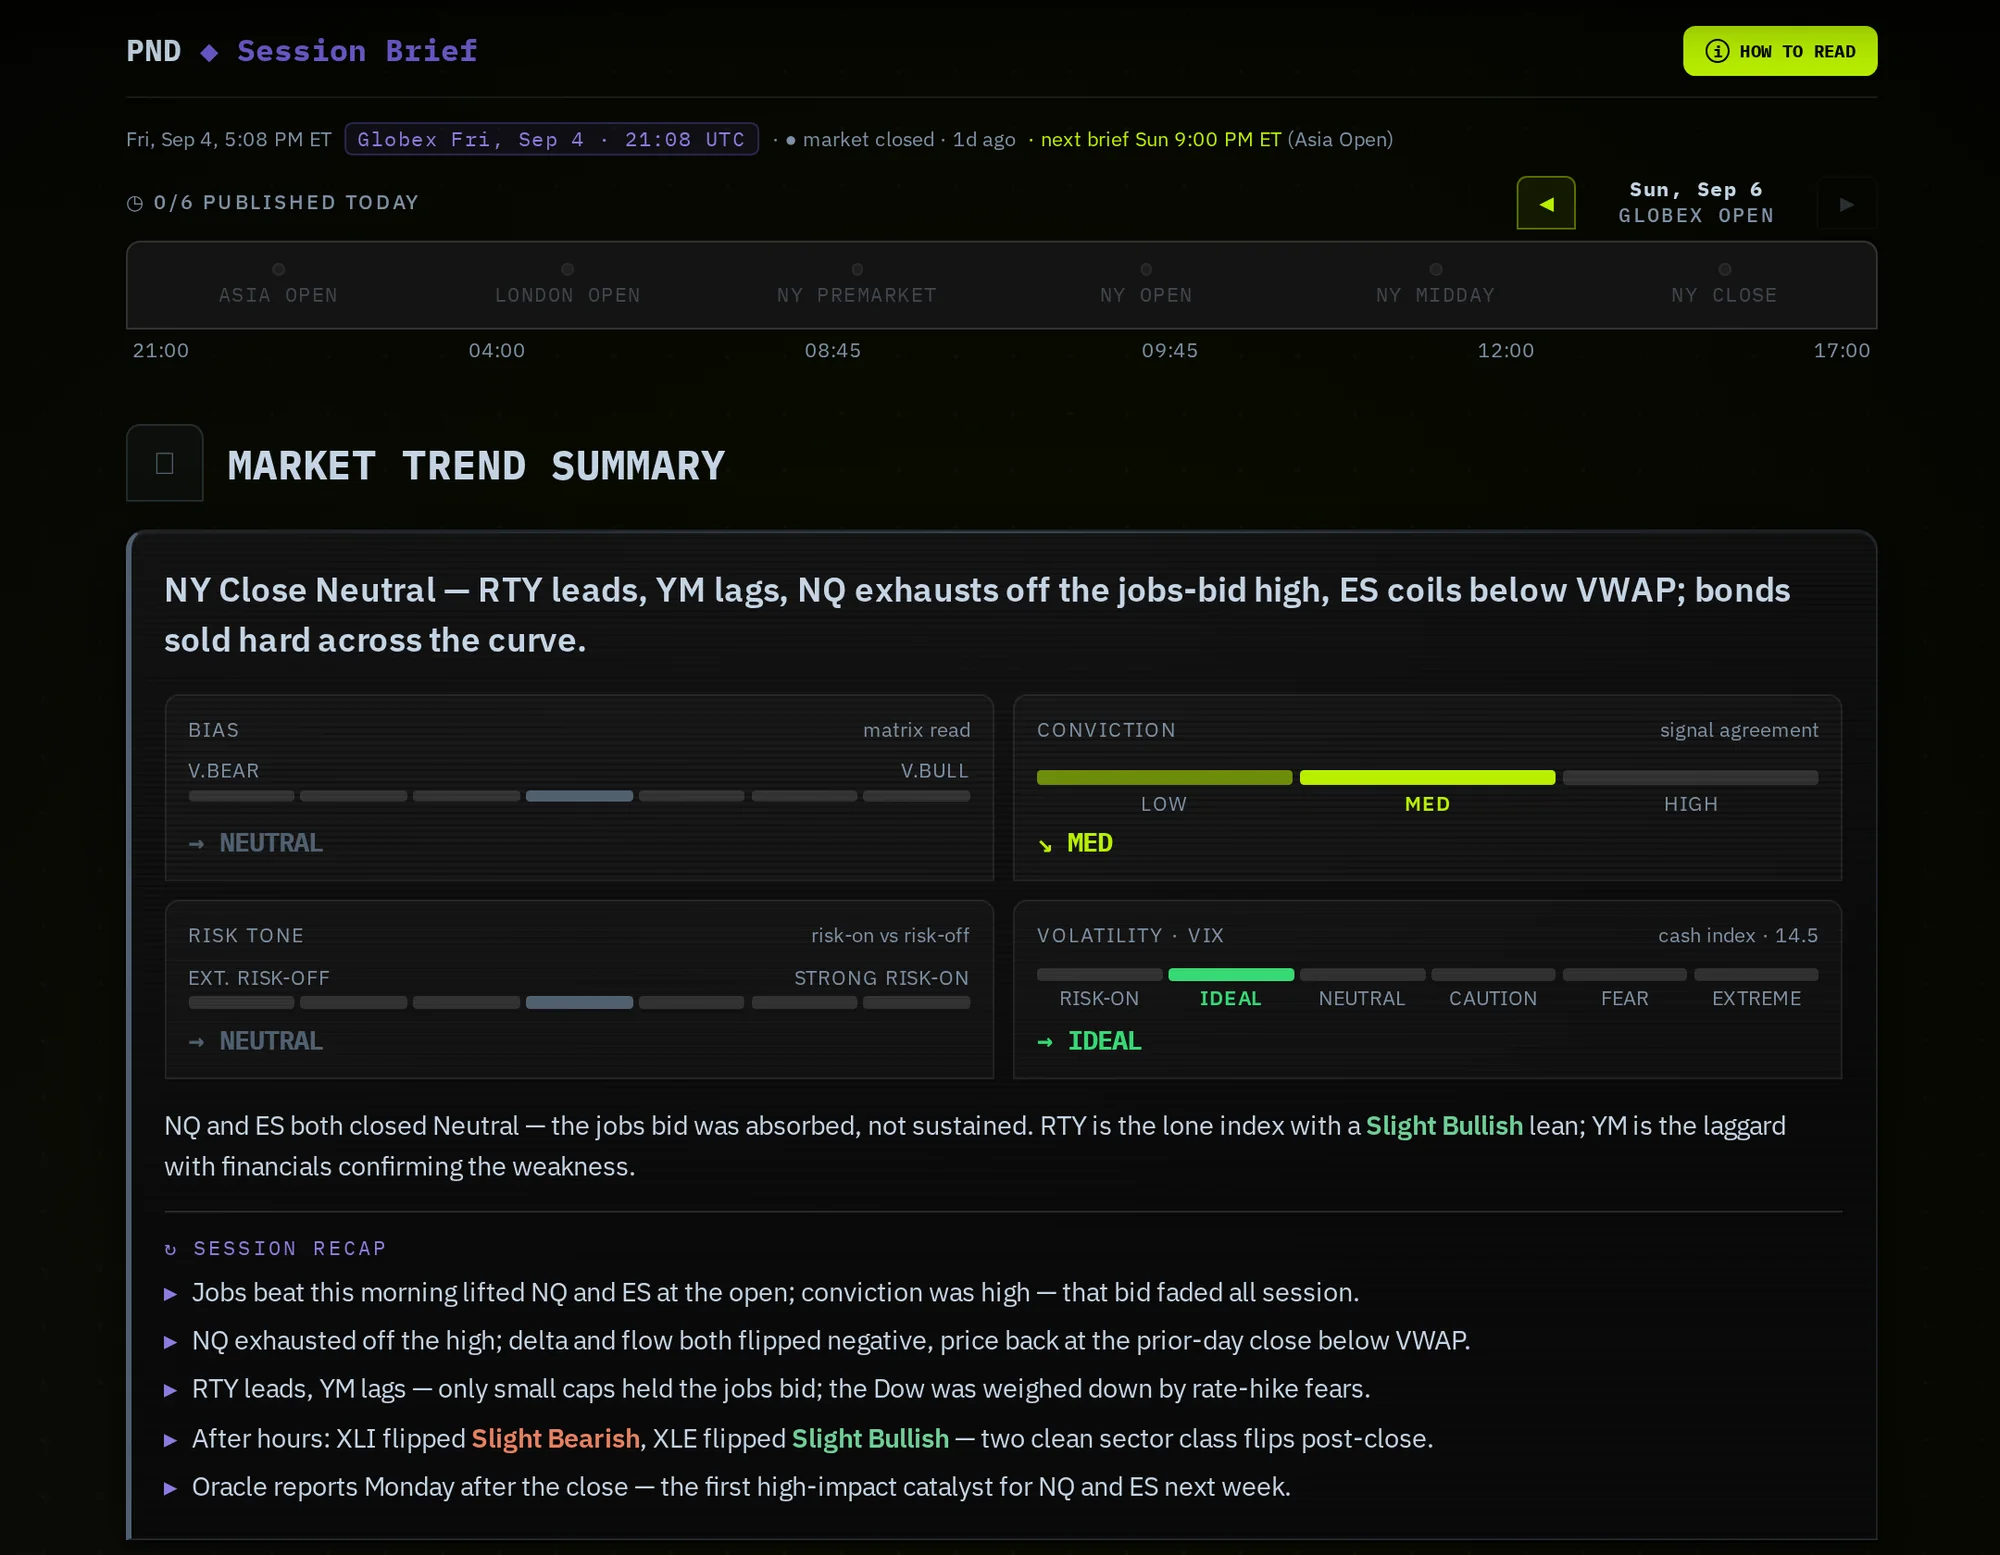
Editions
Six a day, tied to the live CME calendar: Asia Open · London Open · NY Premarket · NY Open · NY Midday · NY Close. The rail across the top shows which have published today; the arrows step back through earlier editions and earlier days, so you can read what was said before a move rather than after it. No editions on weekends, holidays or during the nightly halt.
What's in an edition
| Block | What it gives you |
|---|---|
| Market trend summary | The headline, then four meters — bias, conviction (the same five-check agreement as the board), risk tone, and the VIX regime — followed by the narrative and a session recap. |
| Calendar & news | The economic and earnings events that matter, flagged high-impact or risk event, and the headlines that moved things, each tagged bullish, bearish or neutral. |
| Most aggressive delta | Where the heaviest one-sided buying and selling landed, ranked within each group — the instrument doing the most work in the session — with a one-line tell. |
| Your instruments | The part of the brief about the instruments you have selected: the read, the levels the session turns on, and Path A / Path B — what follows if price takes one route, and what follows if it takes the other. |
| Everything else | The instruments you have not selected, kept separate so they inform without crowding out your own. |
Trade Ideas§
Trade Ideas turns the read into conditional setups for NQ and ES — pick the symbol with the sidebar pills. Each idea is written so it can be judged before you take it and scored after. They are ideas, not signals: something to weigh, never to follow blindly.
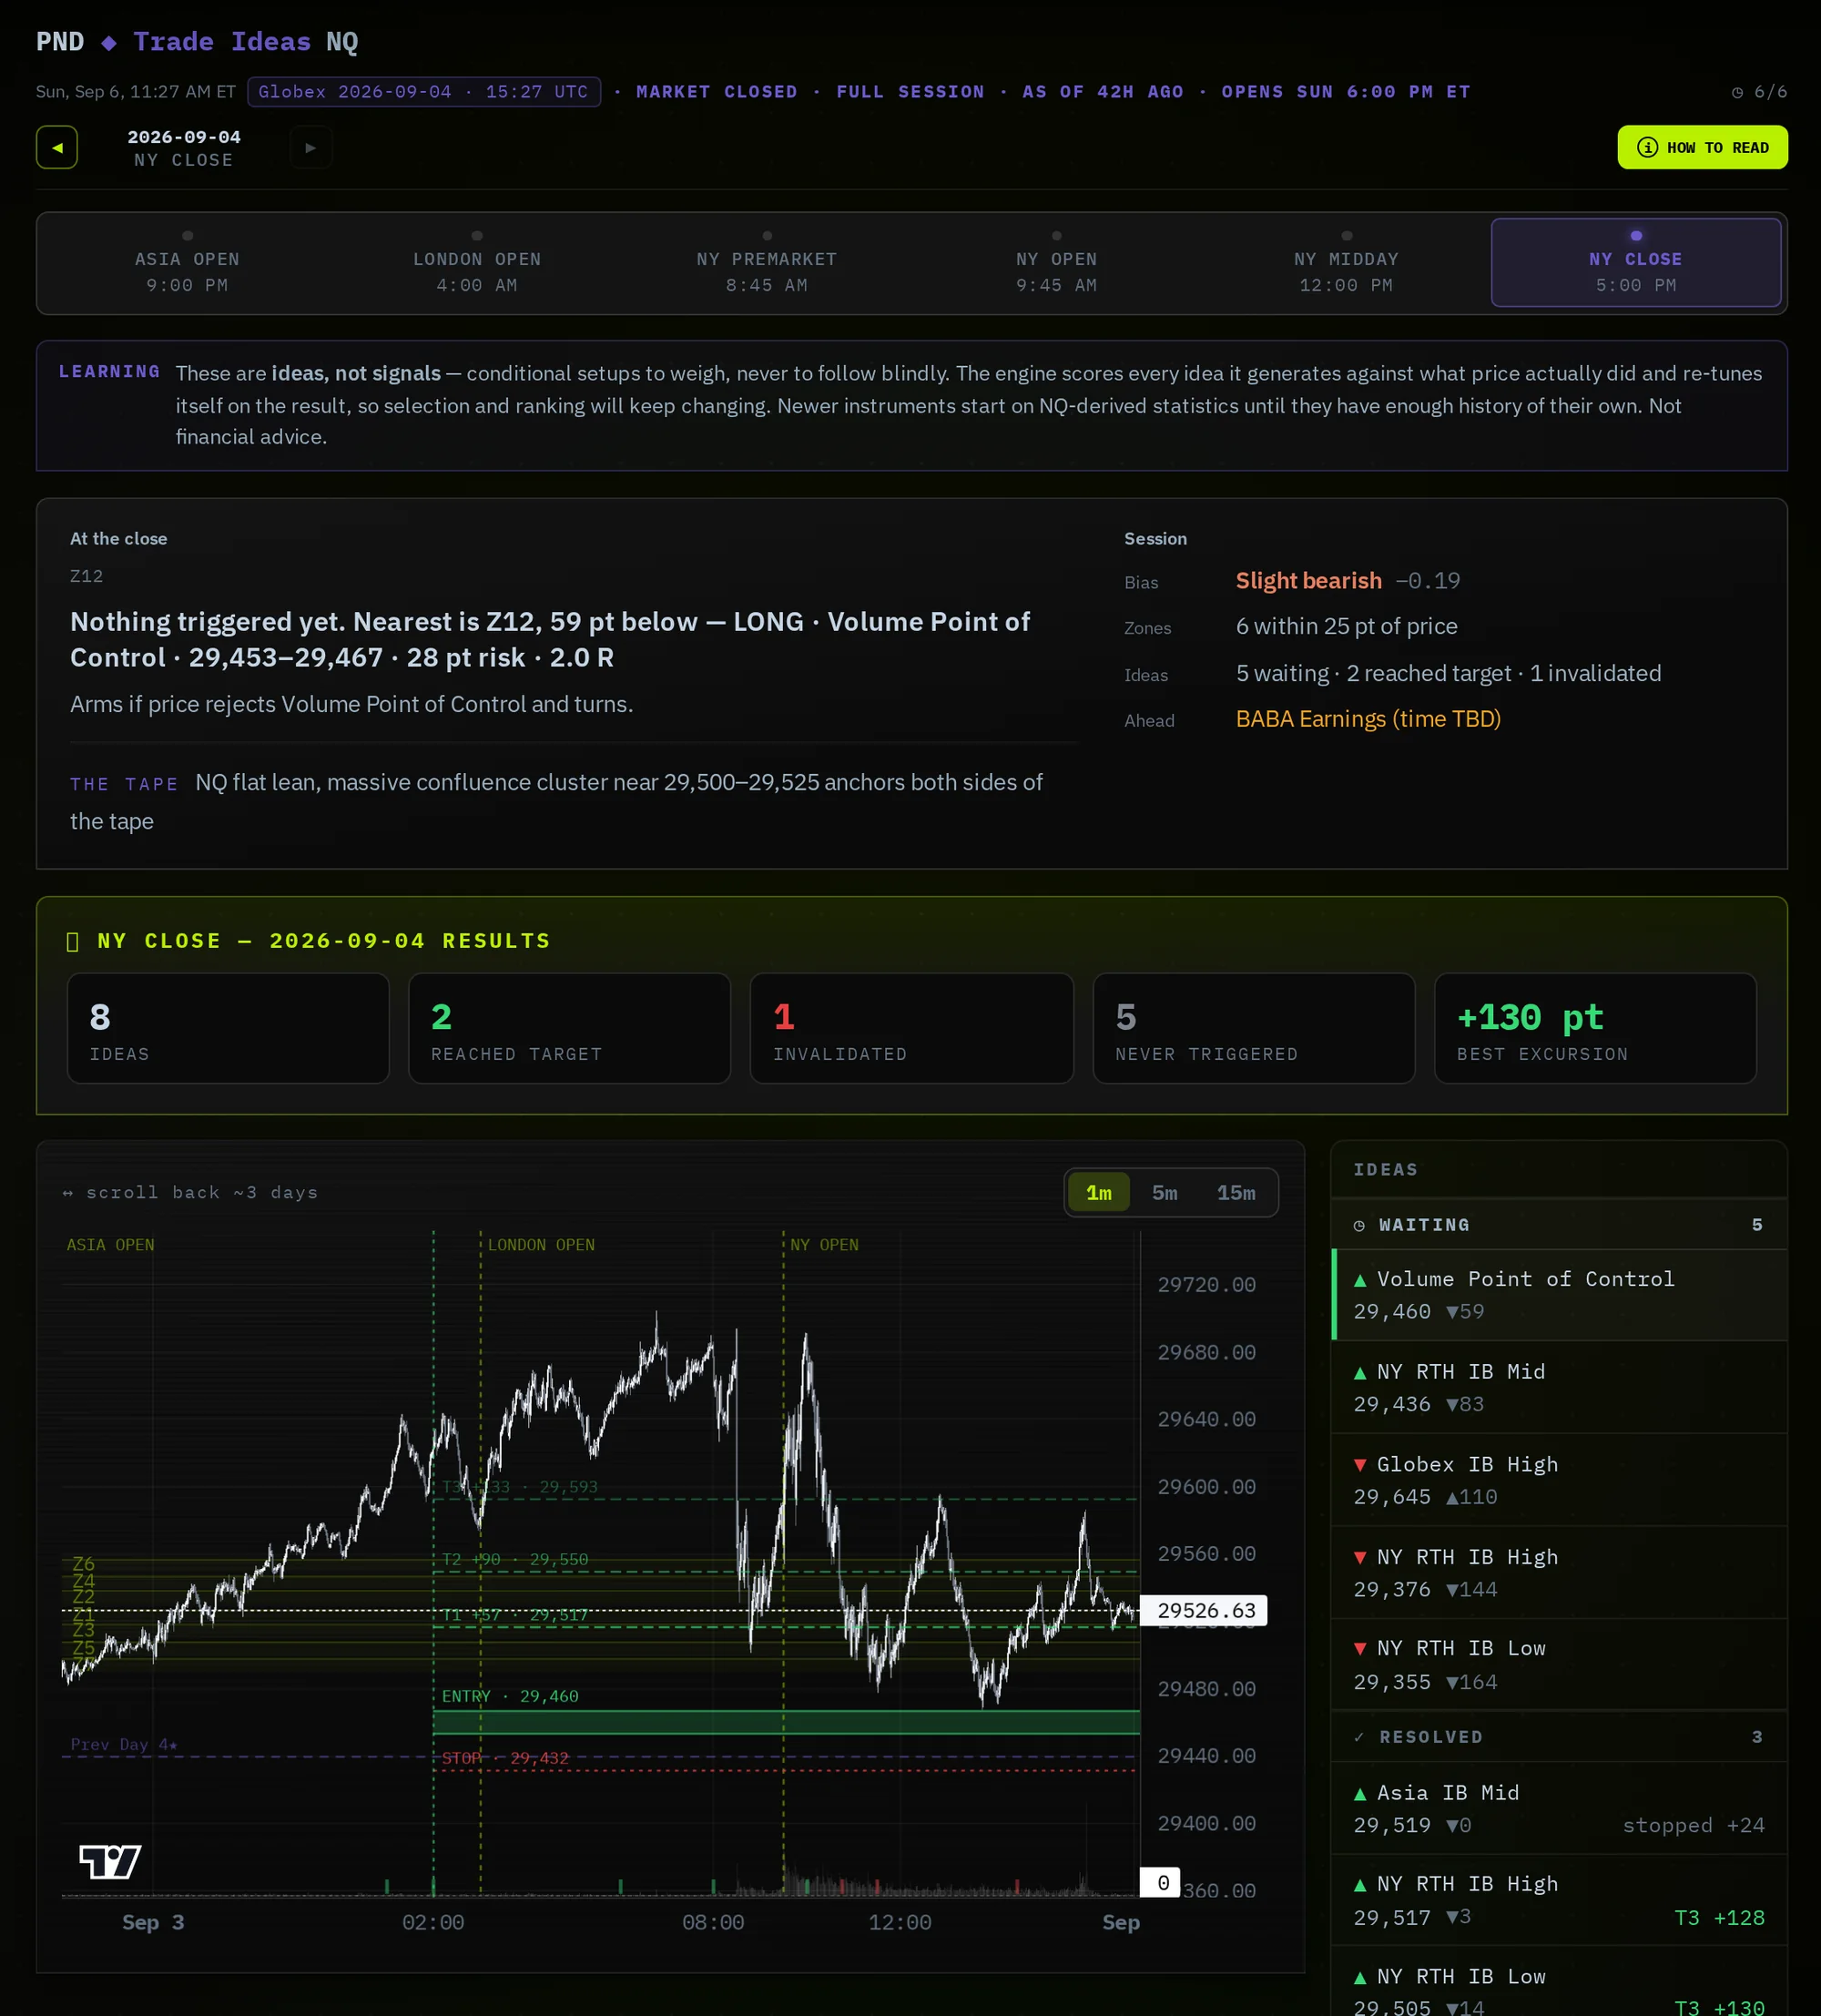
The surface
| Block | What it gives you |
|---|---|
| The read | The session's bias from the same engine as the board, what to do now — press, wait, or stand aside — what's ahead that could change it, and the nearest idea to price. At the close, what actually happened against what was expected. |
| Results | The session scorecard: ideas generated, reached target, invalidated, never triggered, and the best excursion in points. |
| Chart | The session at 1m, 5m or 15m, with the selected idea's entry, stop and targets drawn as rays and the confluence zones shaded. |
| Ideas rail | Every idea for the session — waiting or resolved — with its level, distance from price, and result. |
| Confluence zones | Where reference levels cluster. Nearest, strongest, or all — with distance from price, how many levels stack there, and how many different kinds. |
An idea card
| Field | What it means |
|---|---|
| Trigger | The condition that puts the idea live — a level reached and rejected, not a price predicted. |
| Targets | Where the idea is looking to go, in order, in points. |
| Risk | What it costs if it fails, in points and as a multiple of what it stands to make. |
| If wrong | The price that says the idea is finished — stated up front, so it is not decided while losing. |
| Levels | The reference prices the setup is built on, and which kind each one is. Three different kinds agreeing is stronger evidence than three of the same kind. |
Ideas are generated once per run and stored — the card you are reading is the one written at that time, not a fresh opinion each visit. Every idea is scored against what price actually did afterwards, and the engine re-tunes on the result, so selection and ranking keep improving.
Delta Levels§
Delta Levels is the trade feed the board's Delta dimension scores from, laid out by price and by trade size instead of reduced to one number. One symbol at a time — NQ, ES and GC today, with RTY, YM and CL following as their history fills in.
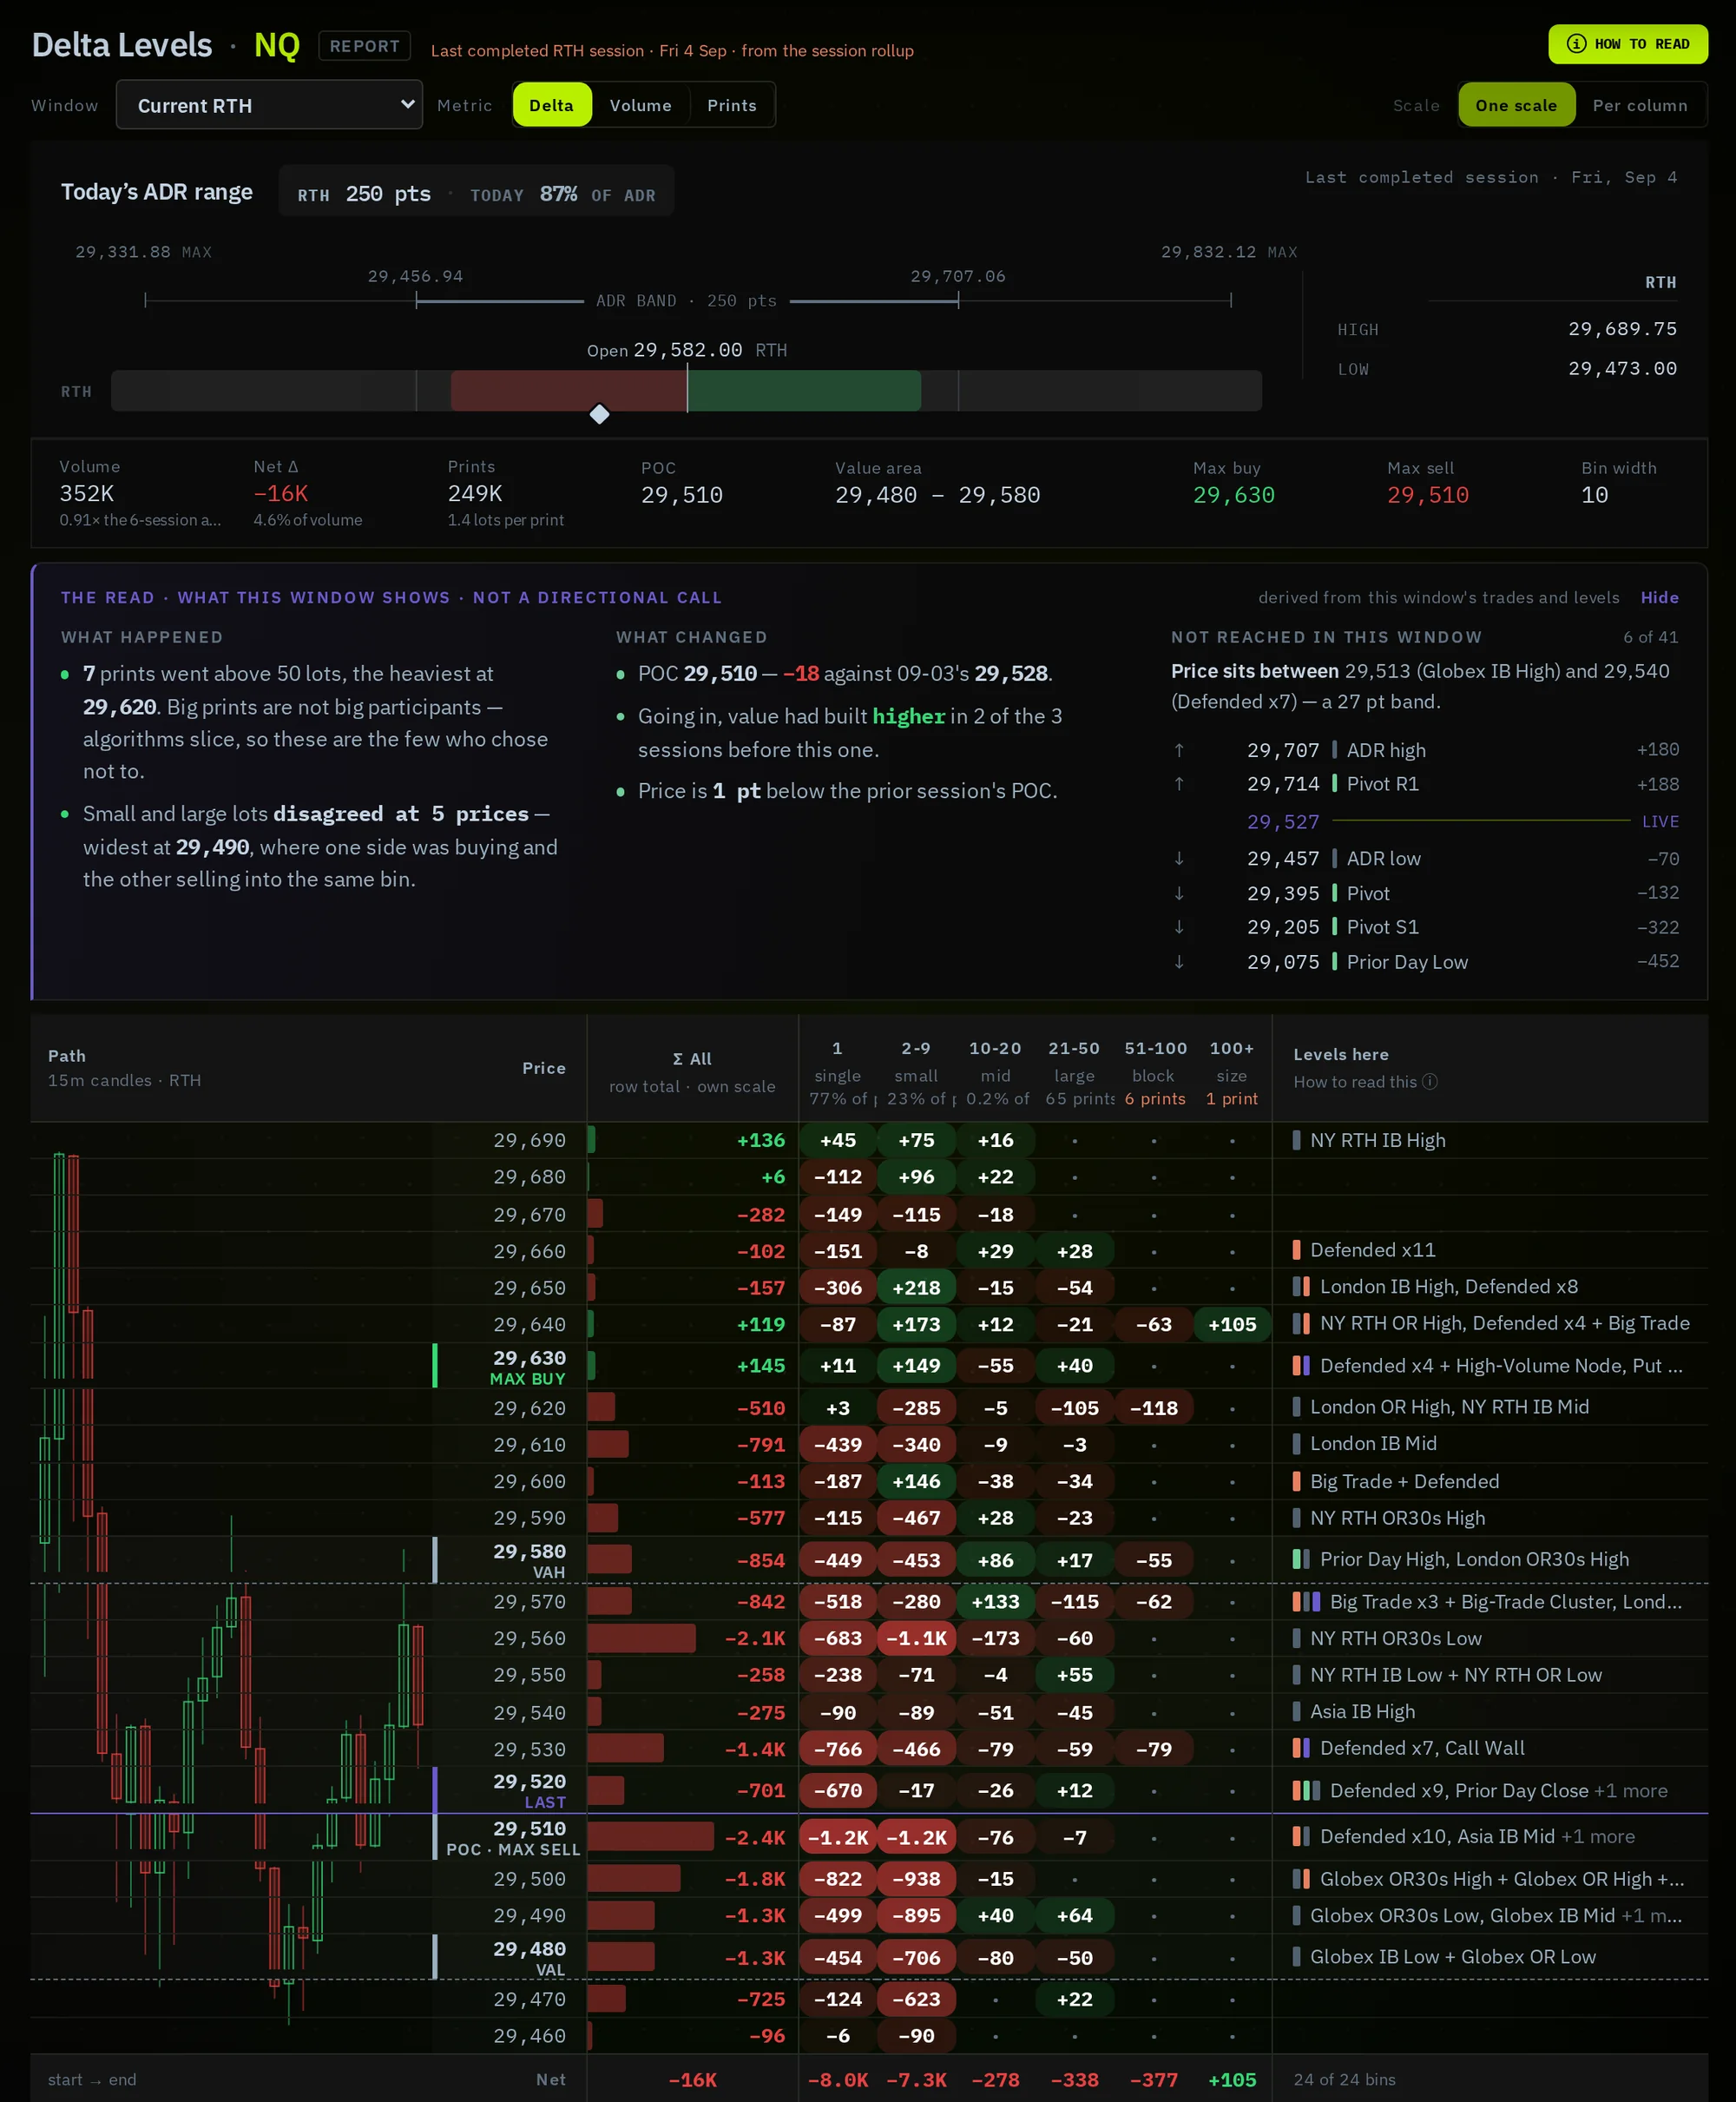
Choose the window first
The controls decide which trades are counted before anything is drawn. Window runs from the last 15 minutes to the last five sessions, for the cash session (RTH) or the full Globex session (ETH), or a custom range. A short window shows today's fight; a long one shows where the market has been building. Metric switches the grid between Delta, Volume and Prints. Scale compares every cell on one scale, or within each size band only.
Reading the surface
| Element | What it means |
|---|---|
| ADR range | The same today's-range strip as the scoreboard, for this window's session. |
| Stats strip | Volume, net delta, prints, POC, value area, the prices with the most net buying and net selling, and the bin width. |
| The read | What happened — the big prints and where large and small lots disagreed; what changed versus the prior session; and the levels above and below that this window has not reached. Explicitly not a directional call. |
| The grid | Price down the side, trade-size buckets across the top. Green is net buying, red net selling; intensity is magnitude. The row total on the left and the path chart beside it show where price went while that was happening. |
| Levels here | The reference levels — session opens, initial balances, prior-day levels, defended prices, big-trade clusters — that sit at each price. |
Sessions & Market Hours§
The desk is session-aware. The official CME trading calendar — not the data — decides whether the market is open, and every surface follows it: weekends, full-close holidays, early closes, and the nightly maintenance halt.
| Session (ET) | What the desk does |
|---|---|
| Asia 18:00–02:00 | Overnight Globex. Reads lean on structure while volume builds. |
| London 02:00–09:15 | EU liquidity. The 08:30 data window (CPI, NFP, PPI) is flagged. |
| Pre-open 09:15–09:30 | Positioning into the bell. |
| NY Open 09:30–09:45 | Peak signal. Flow and participation carry as much weight as trend. |
| RTH 09:45–16:00 | The cash session. The working horizon is Intraday. |
| After-hours 16:00–18:00 | Thin. Reads lean back on structure until Globex re-opens. |
| Closed | Weekends, holidays, the nightly halt. Every surface holds the last real read from the close — nothing is scored as Neutral for lack of data — and says when trading resumes. |
Groups that do not trade overnight — equities and sectors — are shown held at close rather than as if they were live, and the brief says so when it reads them.
Time Replay§
Start replay in the sidebar scrubs the desk back to any moment in the last seven days. The board, the expanded rows and the brief all re-render as they were at that time, with an amber Historical marker so you cannot mistake it for live.
- Start replay and pick a date and time on the scrubber.
- Read the board as it was — including which brief edition was current.
- Exit replay to return to live. Nothing you did in replay is saved.
Use it for post-session review — what was the desk saying when you entered? — for studying how a setup's score built, peaked and faded, and for sharing a moment with the community.
Mobile§
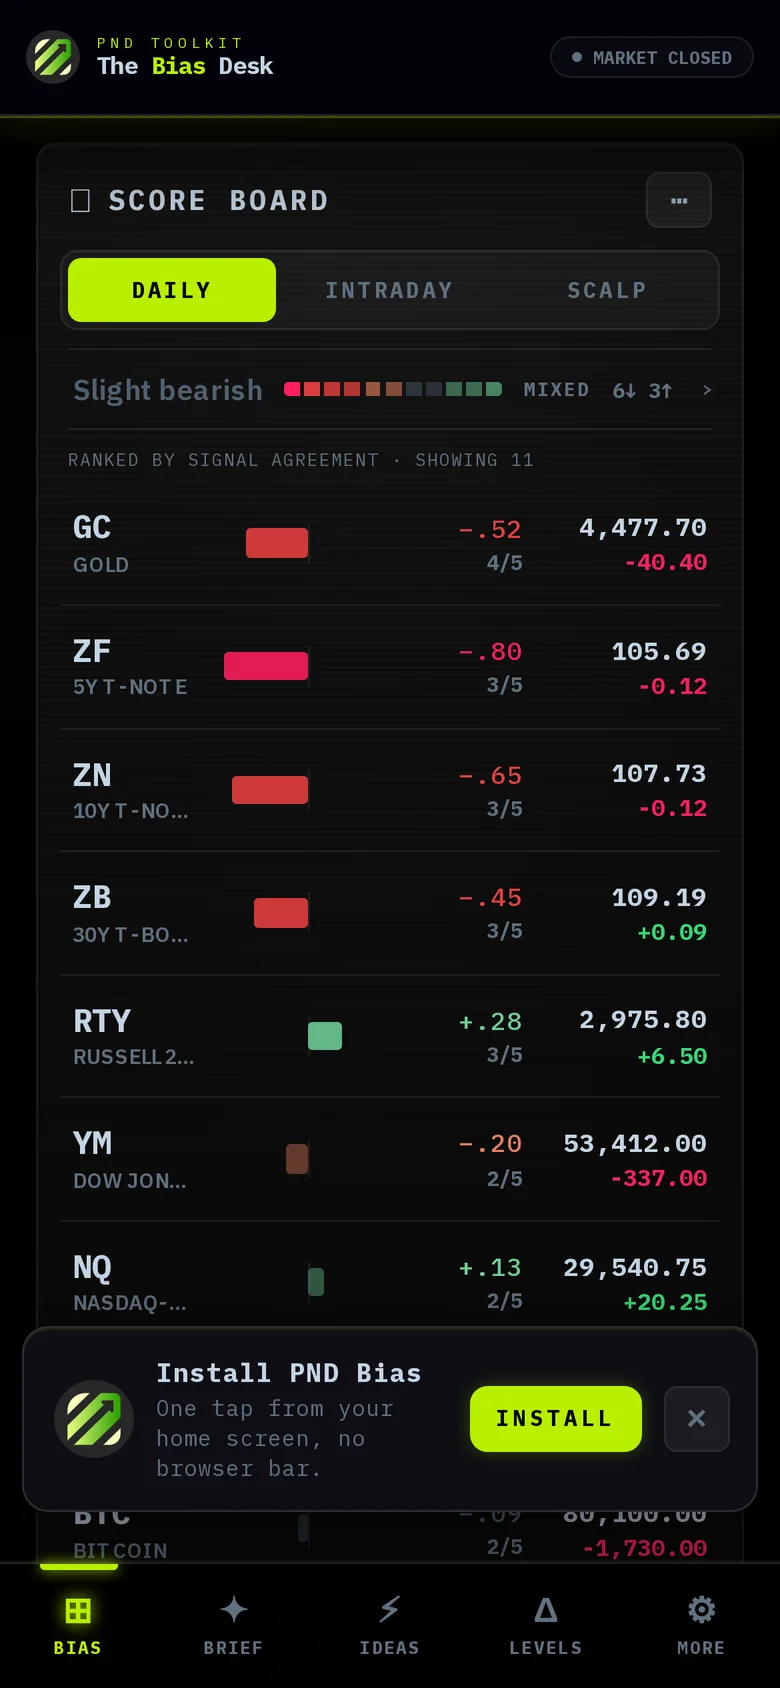
On a phone the four surfaces become the bottom tabs — Bias · Brief · Ideas · Levels — with filters, theme and account under More. The scoreboard keeps the essentials per row: bias, score, agreement, price and change. Tap a row to expand it.
Install it to your home screen from the prompt (or your browser's share menu) for a full-screen desk with no browser bar.
Themes & Settings§
Neon is the dark trading-room theme; Paper is a light one for daylight and screenshots. Switch in the sidebar (or under More on mobile). Your theme, selection, saved groups and horizon persist between visits.
Settings also holds the documentation link, billing, the Discord community, and — for members — profile and notification preferences. API and indicator keys for platform integrations are listed as coming soon.
What's Coming Next§
Exposure Map Soon
A fifth surface built on options flow: a live map of where positioning is stacked above and below price, and the levels that attract or repel it — for the same instruments and horizons as the board.
Exposure Map Soon
Options positioning, mapped to price. The desk already reads options flow as one part of the score; Exposure Map opens it up — where positioning is stacked above and below price, and which levels attract or repel it — for the same instruments and horizons as the board.
Desk Analyst Soon
A real-time AI agent powered by The Bias Desk. Ask what the desk is seeing on an instrument, why Delta is fighting Trend, or what the brief said before the open — and get an answer grounded in the same live numbers the board, brief and ideas already run on.
More instruments on Delta Levels and Trade Ideas Soon
RTY, YM and CL are collecting the price history Delta Levels needs. Trade Ideas beyond NQ and ES follow as each instrument earns its own statistics.
API & platform integrations Soon
Keys for bringing the desk's read onto your charting platform.
FAQ§
Glossary§
Live during Globex hours · All times Eastern (ET)
Questions? Join the Discord community.